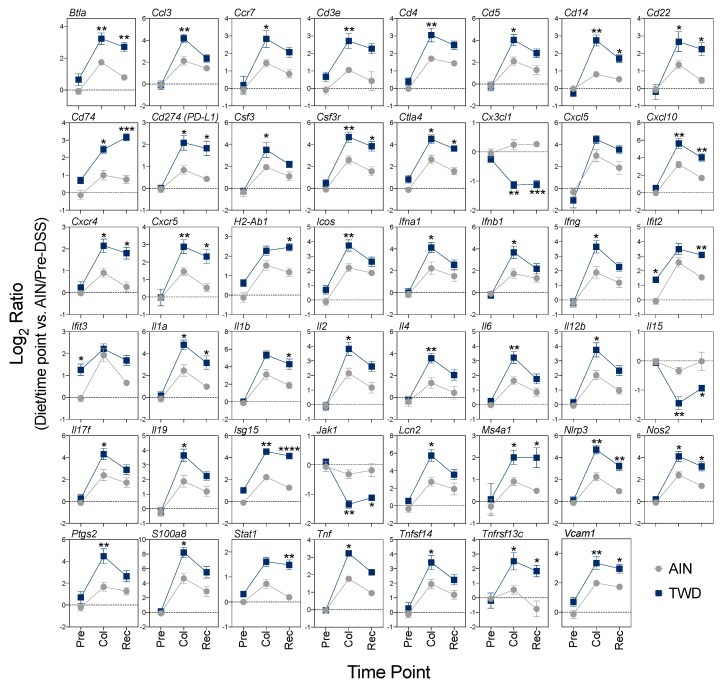
Figure 10.
Expression profiles for selected genes of interest associated with immune and inflammatory responses. Values shown are the average log2 ratio ± SEM for selected genes calculated with AIN/Pre-DSS as the reference. Significant differences in expression (FDR-corrected q-value < 0.05 and log2 ratio > 1 or < −1) between TWD and AIN diets at each time point are noted as follows: * q < 0.05; ** p < 0.01; *** p < 0.001; **** p < 0.0001. Statistical results for comparisons across time points within each diet group are not shown here, but are available in File S2 along with the specific FDR q-values for the significant observations noted in the figure. Pre, pre-DSS; Col, colitis; Rec; recovery.

