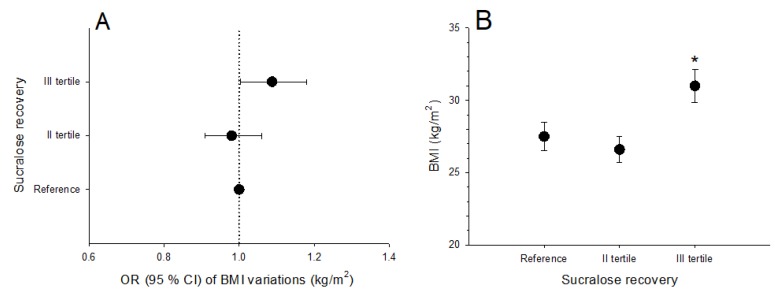
Figure 5.
(A) shows odds ratios and 95 % confidence intervals of BMI variations (kg/m2) in subjects grouped according to tertiles of sucralose urinary excretion. Values were calculated by logistic regression models, with BMI as the dependent variable and tertiles of sucralose recovery as the independent variable, after adjusting for covariates (age, junk score). (B) indicates average BMI (kg/m2) in subjects grouped according to tertiles of sucralose recovery. Data are mean ± SE. *p = 0.02 vs. reference group and subjects in the second tertile (ANOVA followed by Fisher’s LSD multiple comparison test).

