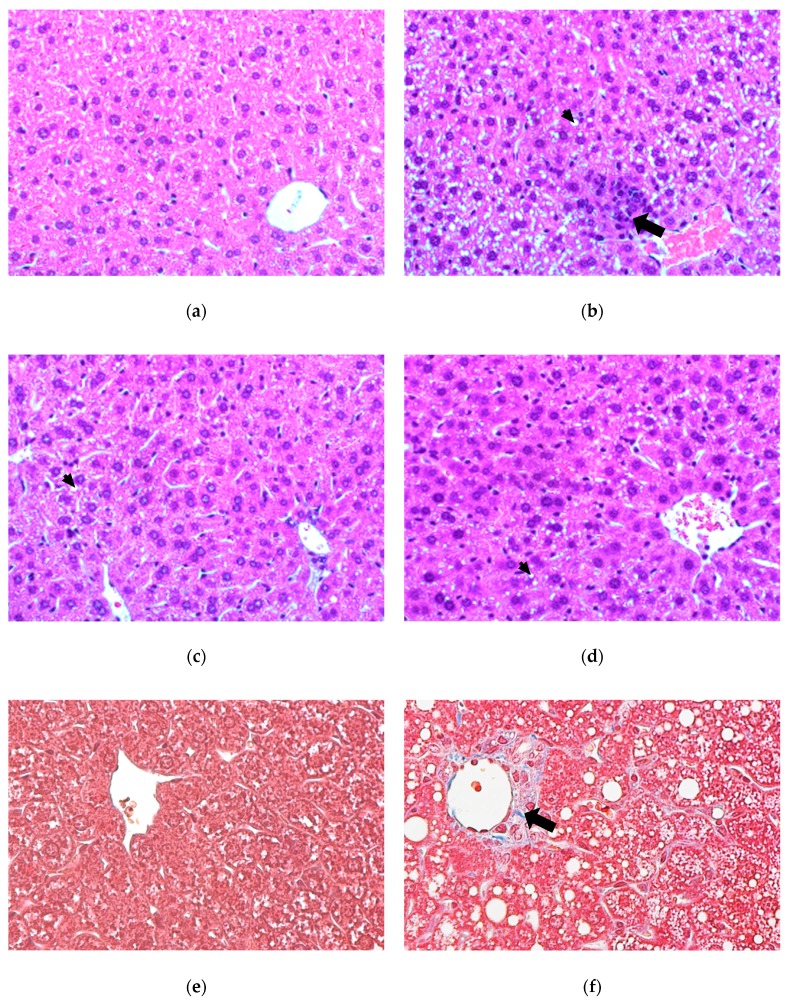
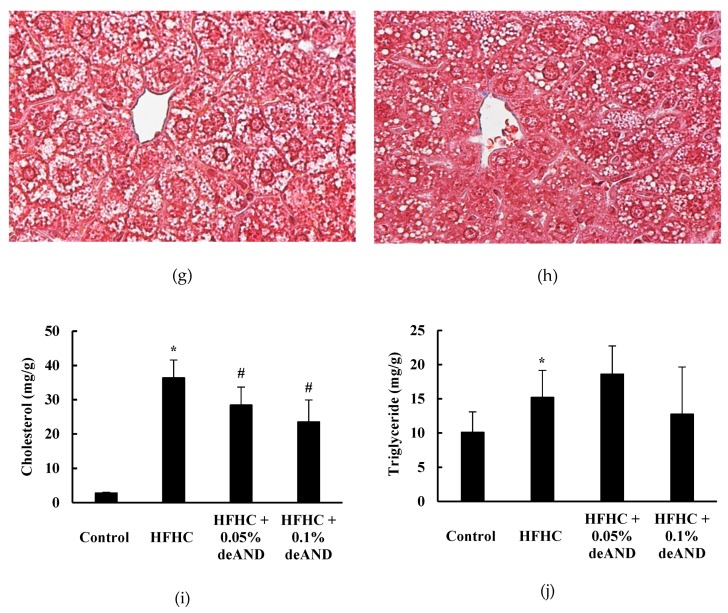
Figure 2.
Histopathological examination (H&E stain, 400x) of livers in the control group (a), HFHC group (b), HFHC + 0.05% deAND group (c), and HFHC + 0.1% deAND group (d). The small arrow indicates the fat droplets and the large arrow indicates the perivenular inflammatory infiltrates. Normal liver architecture was found in the low-fat control group (a). Figure 2e–h shows histopathological examination of liver fibrosis (masson’s trichrome- stain, 400x) in the control group (e), HFHC group (f), HFHC + 0.05% deAND group (g), and HFHC + 0.1% deAND group (h). The large arrow in HFHC group indicates the collagen (blue color). Hepatic cholesterol and triglyceride contents are shown in (i,j). Values are means ± SD. (n = 5–6). * Significantly different from the Control group, p < 0.05. # Significantly different from the HFHC group, p < 0.05. HFHC, high-fat and high cholesterol. deAND, 14-Deoxy-11,12-didehydroandrographolide.


