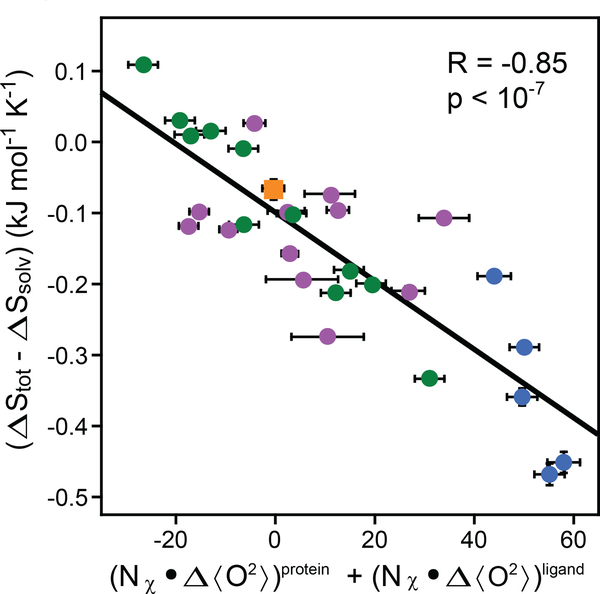
Figure 4.
Calibration of the dynamical proxy for protein conformational entropy. Fitting of Equation 6 to data provided by 28 protein–ligand associations. The difference in the measured total binding entropy and calculated solvent entropy is plotted against the change in the dynamical proxy upon binding of ligands. The dynamical proxy is the average Lipari-Szabo squared generalized order parameter of methyl-group symmetry axes (<>). The fitted slope (sd) of −4.8 ± 0.5 J mol−1 K−1 allows for the conversion between measured changes in methyl-bearing side-chain motion and the associated conformational entropy. Other parameters of the entropy meter are summarized in Table 1. The CaM (calmodulin) and CAP (calmodulin-associated peptide) data subsets are shown in blue and green, respectively. Purple circles represent other binary complexes, as summarized elsewhere (7). The orange square represents the HBP(D24R)–histamine binary complex binding to serotonin, which has a dissociation constant in the millimolar range and was not used in the calibration. See text for details. Adapted from Reference 7.

