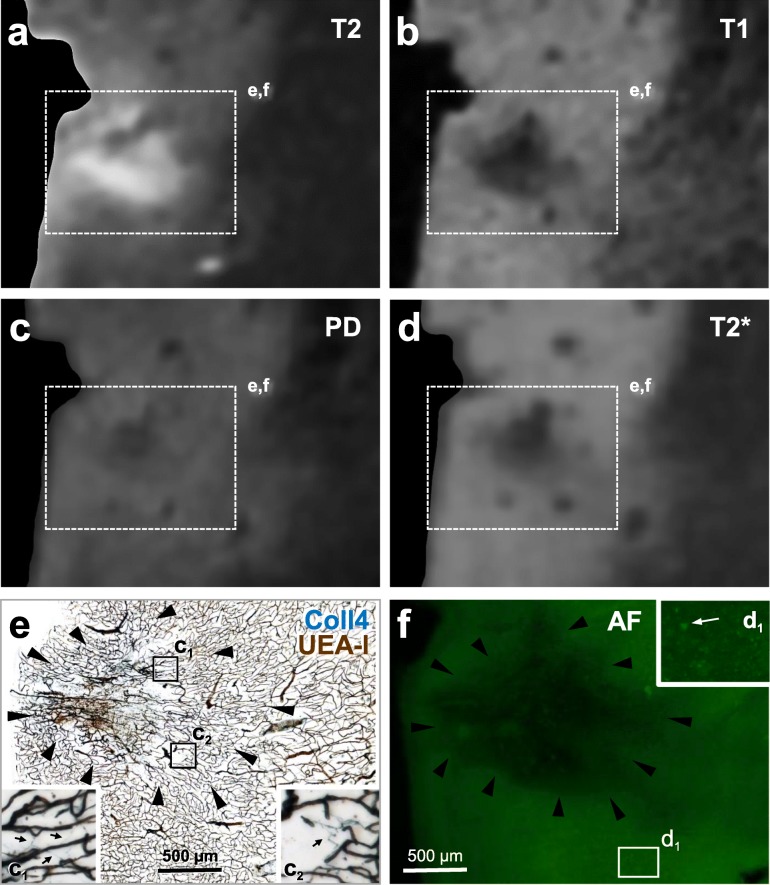
Fig. 10.
Images from a 100 μm-thick brain section with a superficial cavitated microinfarct in the motor cortex (case 1). The section was first scanned with 11.7 T MRI (a-d) and then double-labeled for Coll4 and UEA-l (e) after capturing autofluorescence (f). a The cavity of the microinfarct gave a hyperintense signal in the T2-weighted image. b The T1-weighted MRI signal was hypointense in the microinfarct cavity and in tissue areas that showed thinning. c The PD-weighted image exhibited a hypointense signal in the core and a slightly hyperintense signal in the rim of the microinfarct cavity. d In the T2*-weighted image, large vessels and the microbleed in the cavity produced magnified hypointense signals (blooming effect). e The microinfarct cavity contained damaged microvessels and the rim of the cavity was rich in Coll4-positive string vessels that lacked UEA-l staining. f Autofluorescence (AF) of the tissue was reduced in the microinfarct cavity and in areas with tissue thinning around the cavity. Betz cells could also be identified based on their autofluorescence (arrow in inset d1). Scale bars: 500 μm (e-f)

