Figure 5.
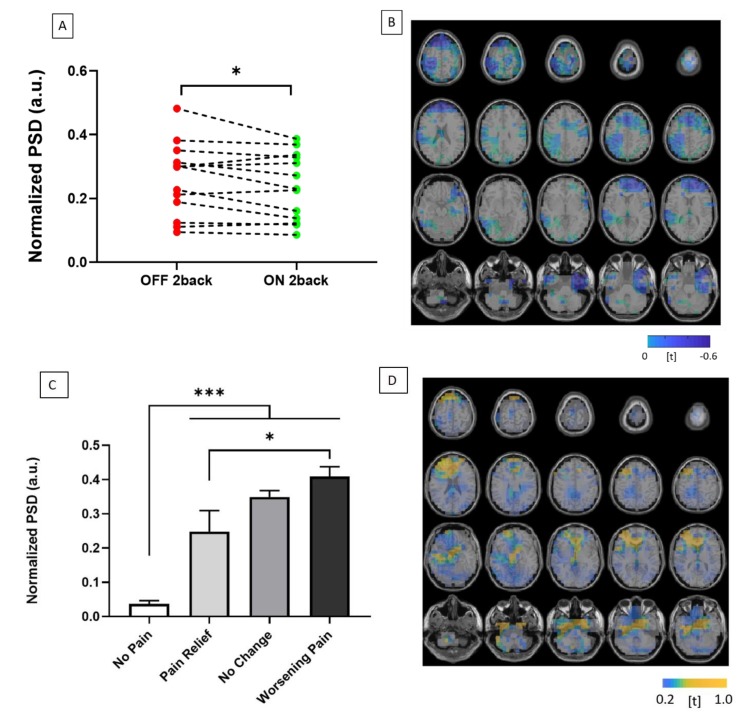
(A) Graph illustrating change in normalized power spectral density (PSD) between OFF (red) and ON (green) DRGS during high cognitive load (2-back condition). (B) 3-D source localization demonstrating t-statistic maps of significant reductions in gamma cortical activity across the prefrontal, anterior cingulate and somatosensory cortices during DRGS-mediated pain relief. (C) Column graph illustrating change in normalized power spectral density (PSD) with DRGS OFF, during high working memory load (2-back condition) compared to resting-state, grouped according to pain response during working memory load: no pain (n = 2), pain relief (n = 2), no change (n = 3) and worsening pain (n = 6) groups (A total of 13 patients were included in the MEG analysis). (D) 3-D source localization demonstrating t-maps, as before, of significant increases in cortical activity across the prefrontal and anterior cingulate cortices during task performance.

