Fig. 3.
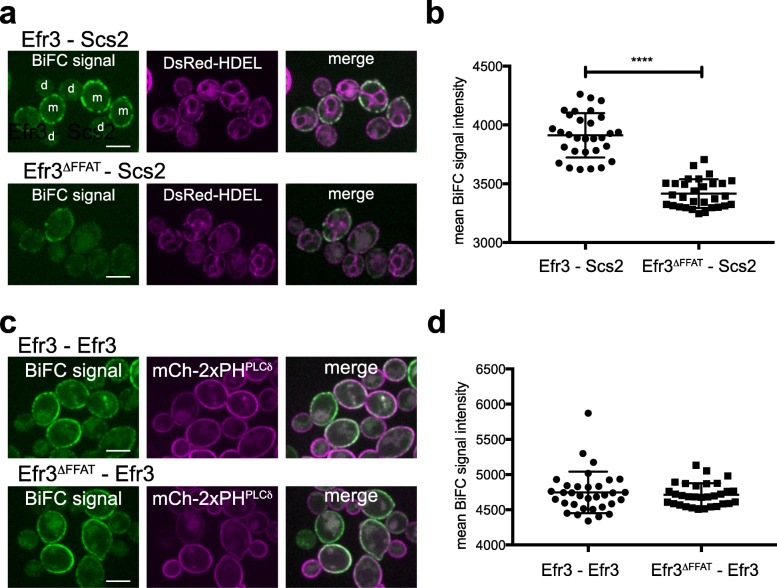
The PIK patch subunit Efr3 interacts with ER-localized Scs2. a The Efr3 FFAT motif promotes Scs2-Efr3 interactions. Interactions between Scs2 and Efr3 or Efr3∆FFAT as scored by BiFC. Cells expressed Efr3-GFPN (upper panel) or Efr3∆FFAT-GFPN (lower panel) along with GFPC-Scs2 and the ER marker DsRed-HDEL (magenta). Scale bars, 5 μm. b Quantitation of specific BiFC signals generated by interaction of Efr3-GFPN or Efr3∆FFAT-GFPN with GFPC-Scs2 at the ER using DsRed-HDEL to define regions of interest. Graph shows the mean values and standard deviations from three independent experiments. Each point represents the mean of an image frame (with > 10 cells/frame); 30 frames (> 300 cells) were analyzed for each. The difference between the BiFC signal in cells expressing Efr3-GFPN versus Efr3∆FFAT-GFPN with GFPC-Scs2 was statistically significant (t test, ****p < 0.0001). c The Efr3 FFAT motif is not required for Efr3-Efr3 interactions. Cells expressed Efr3-GFPN (upper panel) or Efr3∆FFAT-GFPN (lower panel) together with Efr3-GFPC and the PM marker mCherry-2xPHPLCδ. Scale bars, 5 μm. d Quantitation of specific BiFC signals generated by interaction of Efr3-GFPN or Efr3∆FFAT-GFPN with Efr3-GFPc using mCherry-2xPHPLCδ to specify Efr3-Efr3 interactions at the PM. Graph shows the means and standard deviations from three independent experiments. Each point represents the mean value from an image frame (> 10 cells/frame). Total number of frames: Efr3–Efr3 n = 33, Efr3∆FFAT–Efr3 n = 31. The results show no difference between Efr3-GFPN versus Efr3∆FFAT-GFPN in association with Efr3-GFPc

