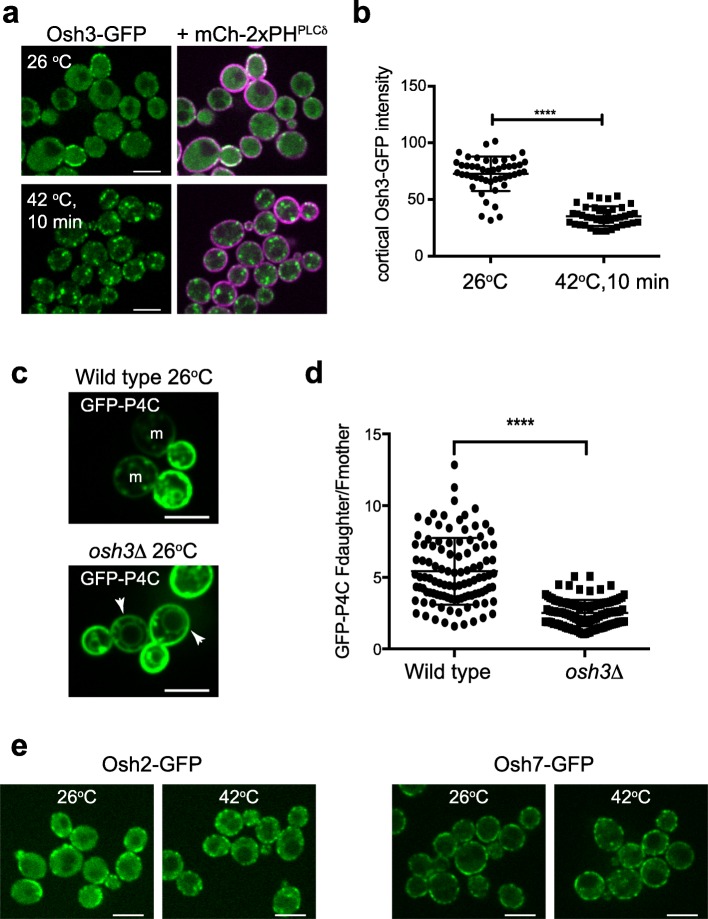
Fig. 4.
Osh3 regulates PI4P metabolism and distribution. a Localization of Osh3-GFP (green) and the PM marker mCherry-2xPHPLCδ (magenta) at 26 °C and after 10 min heat shock at 42 °C. Upon heat shock, Osh3 switches from cortical patches to internal puncta. Scale bars, 5 μm. b Quantitation of cortical Osh3-GFP fluorescence intensity in cells at 26 °C versus 10 min 42 °C heat shock. The PM marker mCherry-2xPHPLCδ was used to define cortical regions of interest. Graph shows the means and standard deviations from three independent experiments. Points present mean values of individual image frames (> 10 cells/frame). Total number of frames analyzed: 26 °C n = 48, 42 °C n = 41. The decrease of cortical Osh3-GFP fluorescence after heat shock was statistically significant (t test, ****p < 0.0001). c Wild type (upper panel) and osh3∆ (lower panel) cells expressing the PI4P reporter GFP-P4C grown at 26 °C. Arrows point to PI4P at the PM in mother (m) cells. Scale bars, 5 μm. d Quantitation of cortical GFP-P4C fluorescence intensity in wild type and osh3∆ cells grown at 26 °C. See Fig. 1c for details of analysis. Graph shows the Fd/Fm ratios of individual cells from three independent experiments, bars represent mean and standard deviations (t test, ****p < 0.0001). Number of cells analyzed: WT n = 105, osh3∆ n = 117. e Cells expressing Osh2-GFP (left panel) or Osh7-GFP (right panel) grown at 26 °C and subjected to a heat shock for 10 min at 42 °C. Scale bars, 5 μm

