Fig. 6.
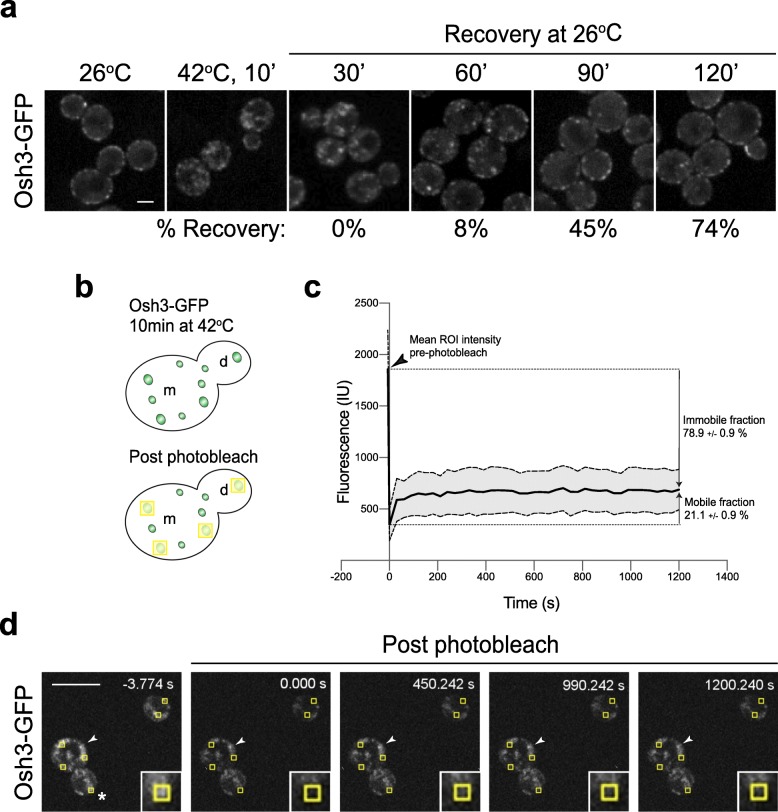
Osh3 aggregates under heat stress conditions. a Recovery of Osh3-GFP to the plasma membrane after heat stress and return to non-stress conditions. Exponentially growing wild type cells expressing Osh3-GFP were grown at 26 °C, shifted to 42 °C for 10 min, and allowed to recover at 26 °C. Images were collected at the time points indicated. The percentage of cells without cytosolic aggregates at each time point is shown (averages of > 390 cells/time point from two independent experiments). Scale bar, 2 μm. b Schematic displaying fluorescence recovery after photobleaching (FRAP) analyses on Osh3-GFP intracellular puncta formed upon heat shock. The yellow boxes mark the photobleached regions. c Quantitative FRAP analyses of internal Osh3-GFP puncta formed after brief heat shock. The mean intensity of 22 puncta (ROI) from two independent experiments is shown prior to (arrowhead) and following photobleaching (solid black line). Standard deviation is shown (gray area between dashed lines). The mobile and immobile fractions are indicated. d Time-lapse images of cells with internal Osh3-GFP puncta formed after brief heat shock. Cells expressing Osh3-GFP were grown at 26 °C and shifted to 42 °C for 10 min prior to being placed on a coverslip for time-lapse FRAP imaging. Images were taken at the time points indicated. The yellow boxes demarcate the photobleached regions of interest (ROI) and the inset shows a × 3 magnification of an individual photobleached ROI (asterisk). The arrowheads indicate an example of an Osh3-GFP aggregate that was not photobleached and remained stable throughout the course of the experiment. Scale bar, 10 μm

