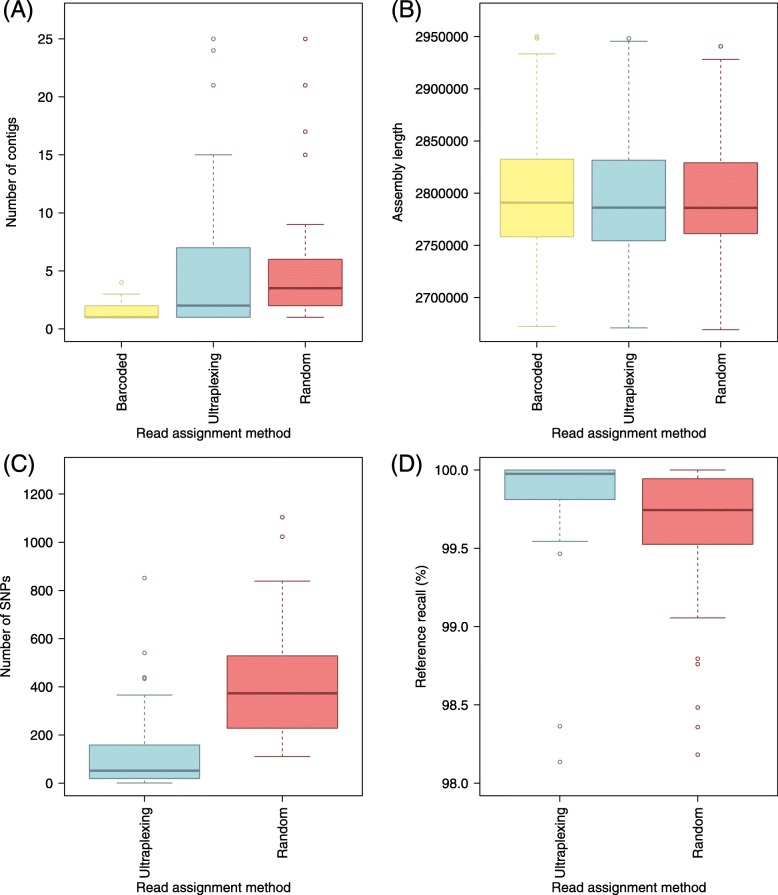
Fig. 4.
Ultraplexing and classical molecular barcoding on a set of 48 S. aureus isolates. a The distribution of contigs per assembly. b The distribution of assembly lengths. c The distribution of SNPs per assembly. d The distribution of reference recall. SNPs and reference recall are calculated relative to assemblies based on molecular barcoding, and the same Illumina sequencing data were used throughout. Barcoded, molecularly barcoded Nanopore data, 5 flow cells with ≤ 10 samples each; Ultraplexing, reads assigned by the Ultraplexing algorithm, 1 flow cell with 48 samples; Random, reads from the Ultraplexing run, assigned randomly

