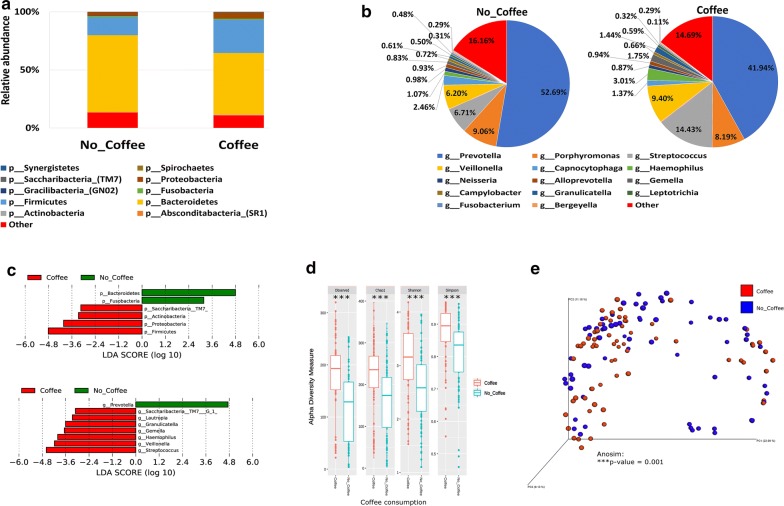
Fig. 7.
Influence of Coffee consumption on the salivary microbiome composition. Y-axis shows % of relative abundance; X-axis indicates the microbial abundance in males and females; each taxonomic category is shown by a different color: a at the phylum level; b at the genus level; c graphs of linear discriminant analysis (LDA) scores for differentially abundant bacterial phyla and genera; among the two groups. LDA scores indicate overrepresented bacteria in individuals that do not drink coffee (green) and the participants that are considered coffee drinkers (red). Features with LDA scores ≥ 2 are presented. d Alpha diversity measures for the two groups. Alpha diversity was measured by the number of OTUs observed or by the Chao1, Shannon and Simpson diversity measures; e Principle Coordinates Analysis (PCoA) based on Bray–Curtis dissimilarities of salivary microbiome. Axes are scaled to the amount of variation explained; ***P < 0.001

