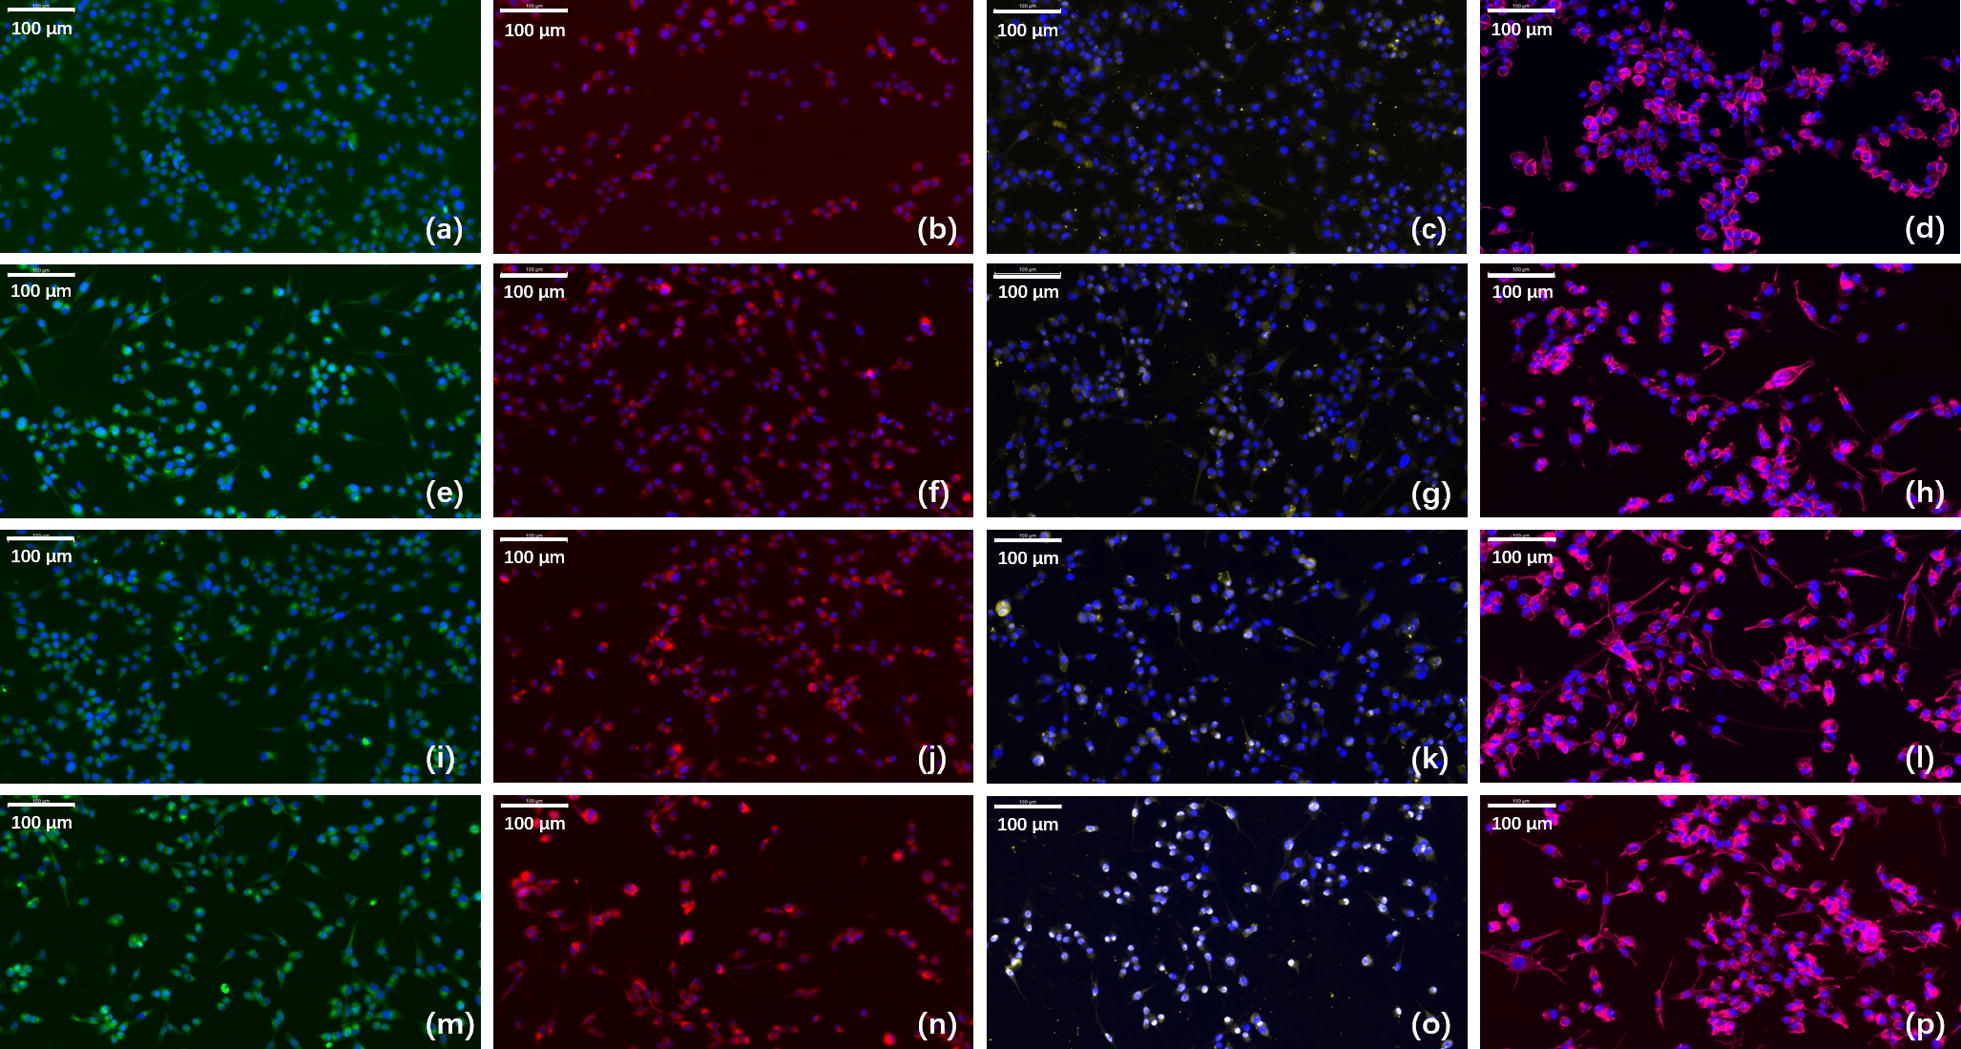
Fig. 4.

Immunofluorescence staining for GFAP, S100, and Tuj1 and phalloidin staining for RSC morphology observation in a–d PBS treated group, e–h VEGF group, i–l NGF group, and m–p VEGF + NGF group. Images a, e, i, m are staining for GFAP (green) and DAPI (blue). Images b, f, j, n are staining for S100 (red) and DAPI (blue). Images c, g, k, o are staining for Tuj1 (yellow) and DAPI (blue). Images d, h, l, p are staining for actin (pink) and DAPI (blue). Scale bar is 100 μm
