Figure 4.
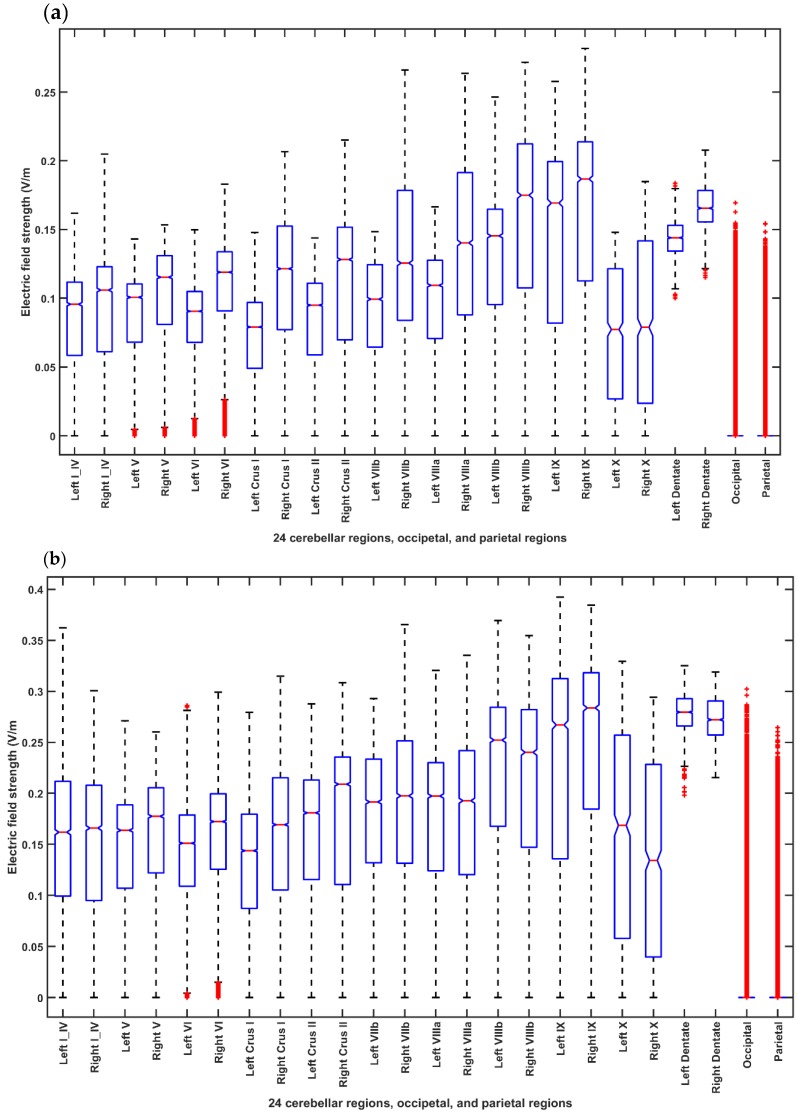
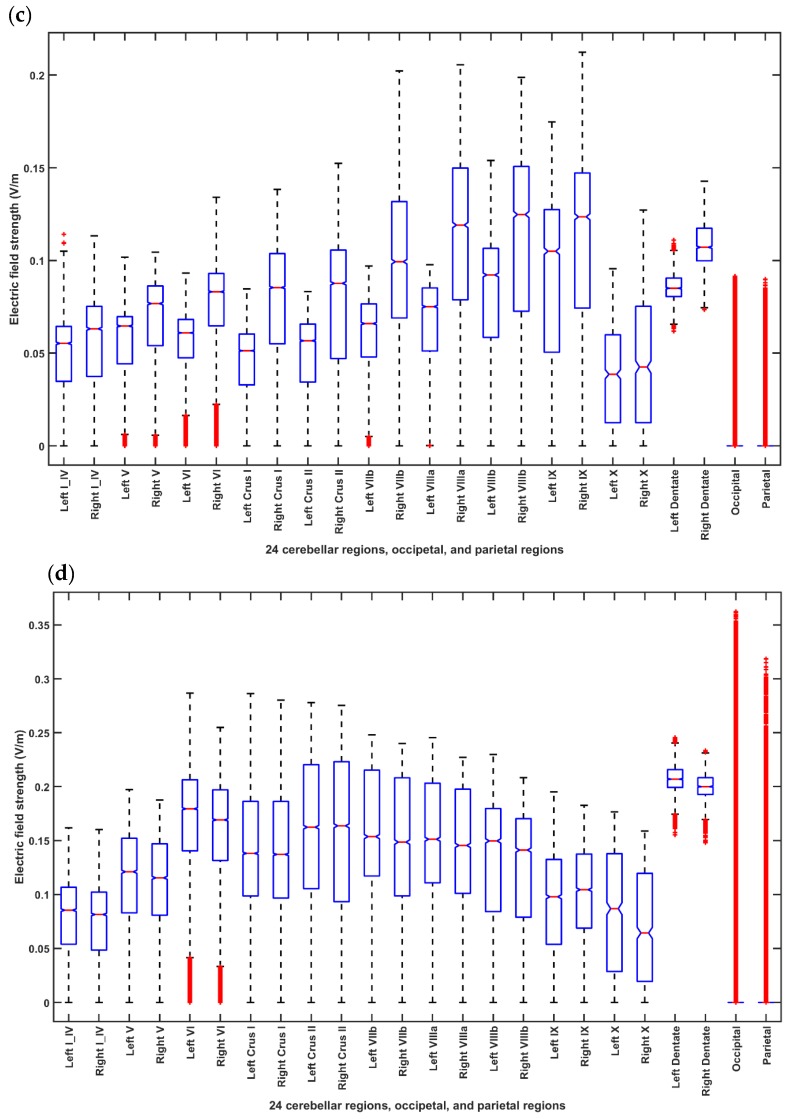
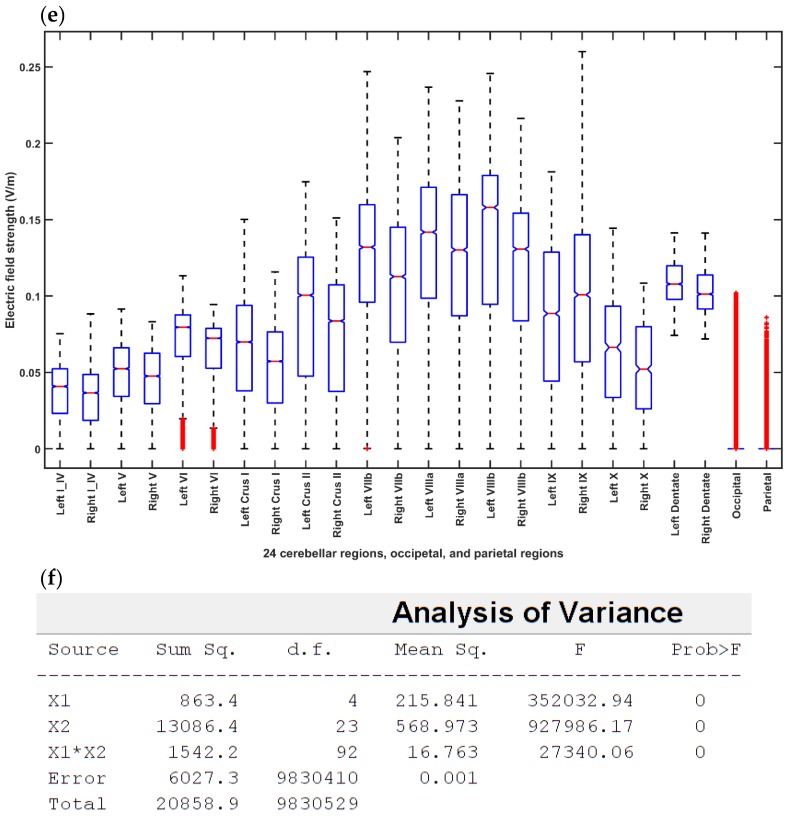
Boxplot of the electric field distribution for different ctDCS montages for the head model from the MRI template of 55-59 years age-group across 24 cerebellar regions, occipital and parietal lobes where in each box, the central mark indicates the median, and the bottom and top edges of the box indicate the 25th and 75th percentiles, respectively. The whiskers extend to the most extreme data points not considered outliers, and the outliers are plotted individually using the ‘+’ symbol. If the notches in the box plot do not overlap, one can conclude, with 95% confidence that the true medians do differ. (a) Shows the EF distribution for the Celnik montage. (b) Shows the EF distribution for the Manto montage. (c) Shows the EF distribution for the Extracephalic montage. (d) Shows the EF distribution for the PO9h–PO10h montage for case 1 (Optimization for dentate nucleus). (e) Shows the EF distribution for the Exx7–Exx8 montage for case 2 (Optimization for lobules VII–IX). (f) ANOVA table: Two-way ANOVA for the factors of interest–montages (X1), brain regions (X2), and their interactions (montage* brain region)–all found significant. Source: Source of variability; Sum Sq.: Sum of Squares due to each source; d. f.: Degrees of freedom associated with each source; Mean Sq.: Mean Square for each source, which is the ratio Sum Sq. /d. f. F: statistics which is the ratio of the mean squares.


