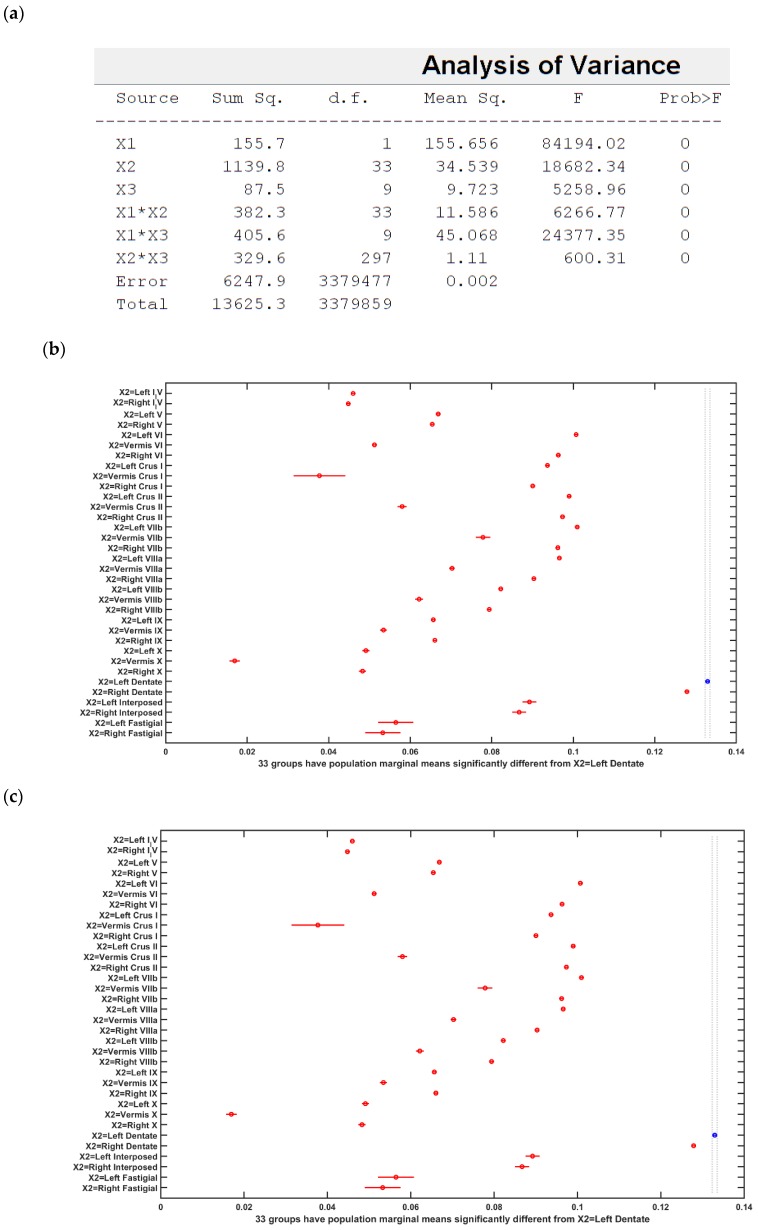
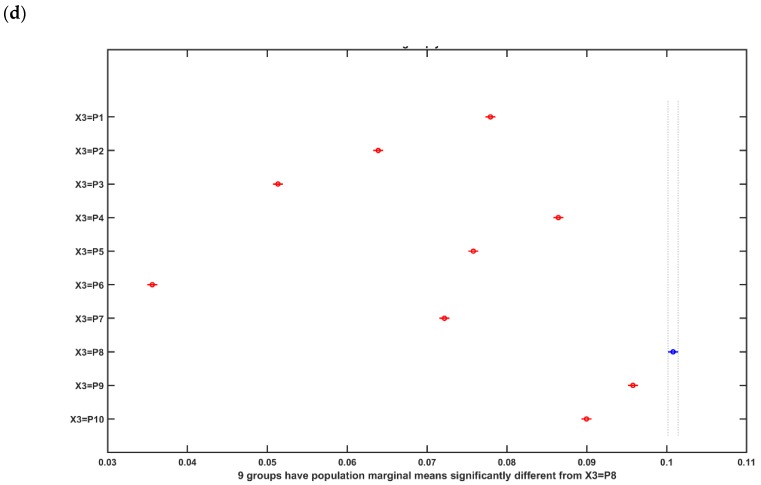
Figure 7.
(a) ANOVA table: Three-way ANOVA for the factors of interest–montages (X1), brain regions (X2), subject (X3), and their interactions–all found significant. (b) Results of the multiple comparison test of the population marginal means between the PO9h–PO10h montage and the Exx7 – Exx8 montage (X1). (c) Results of the multiple comparison test of the population marginal means of different brain regions (X2). The dentate nuclei were exposed to the highest electric field strength (>0.12 V/m) across montages (X1) and subjects (X3). (d) Results of the multiple comparison test of the population marginal means of different subjects (X3). Subject P8 was exposed to the highest electric field strength (>0.1 V/m) across montages (X1) and brain regions (X2). Source: Source of variability;.Sum Sq.: Sum of Squares due to each source; d. f.: Degrees of freedom associated with each source; Mean Sq.: Mean Square for each source, which is the ratio Sum Sq. /d. f. F: statistics which is the ratio of the mean squares.


