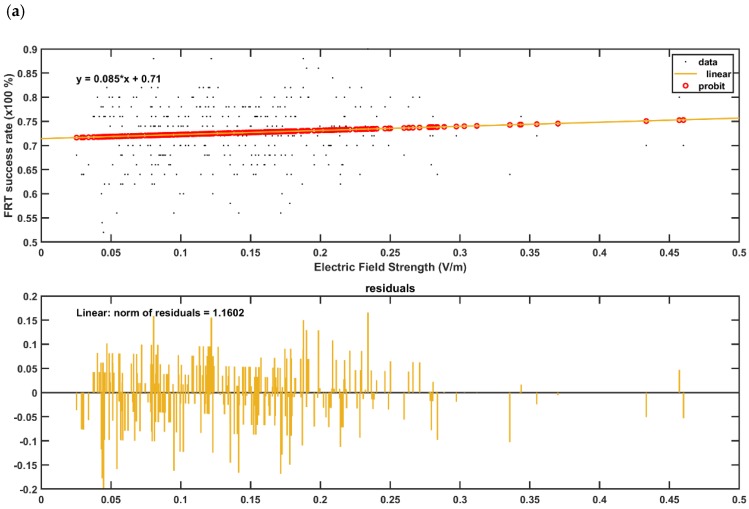
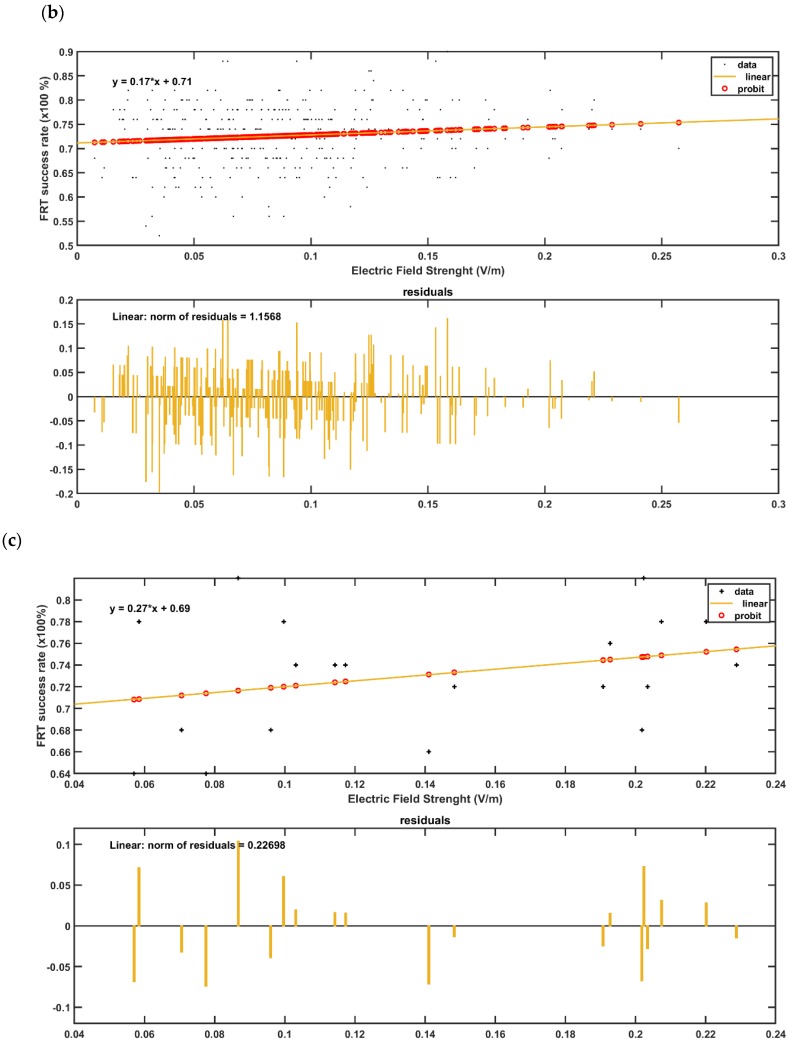
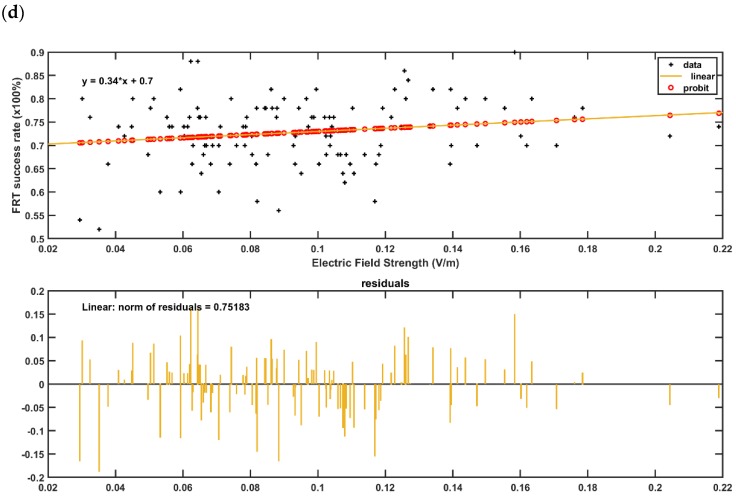
Figure 8.
(a,b) GLM model (with probit link) for the post-intervention FRT success rate (%) with the lobular maximum electric field strength as the predictor in (a), and with the lobular median electric field strength as the predictor in the (b). The plot shows the observed and estimated the FRT success rate (%) versus the predictor values as well as the residuals where the FRT success rate (%) found to be more sensitive to lobular median electric field strength (slope 0.17—Figure 8b) than the lobular maximum electric field strength (slope 0.09—Figure 8a). (c,d) GLM model (with probit link) for the post-intervention FRT success rate (%) with the median electric field strength in dentate nuclei as the predictor in the c), and with the median electric field strength in the bilateral cerebellar leg area lobules as the predictor in the (d). The plot shows the observed and estimated the FRT success rate (%) versus the predictor values as well as the residuals where the FRT success rate (%) found to be more sensitive to the leg area lobular median electric field strength (slope 0.34—Figure 8d) than the dentate nuclei median electric field strength (slope 0.27—Figure 8c).


