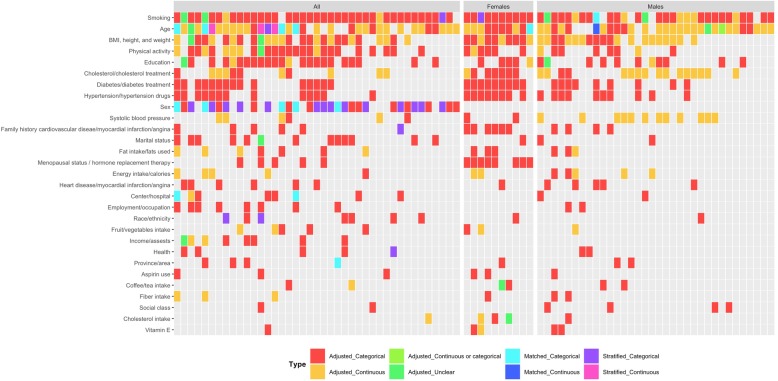
Fig. 3.
A “data microarray” illustrating the higher-level confounder domains considered in 85 observational studies on alcohol exposure and ischemic heart disease, stratified by the type of population considered. Domains are ordered based on how many times they were included in multivariate models. Colors represent whether domains were adjustment, stratification, or matching variables and how they were measured. Refer to Additional file 4: Figure S3 for a larger data microarray

