© The Author(s). 2020
Open AccessThis article is licensed under a Creative Commons Attribution 4.0 International License, which permits use, sharing, adaptation, distribution and reproduction in any medium or format, as long as you give appropriate credit to the original author(s) and the source, provide a link to the Creative Commons licence, and indicate if changes were made. The images or other third party material in this article are included in the article's Creative Commons licence, unless indicated otherwise in a credit line to the material. If material is not included in the article's Creative Commons licence and your intended use is not permitted by statutory regulation or exceeds the permitted use, you will need to obtain permission directly from the copyright holder. To view a copy of this licence, visit http://creativecommons.org/licenses/by/4.0/. The Creative Commons Public Domain Dedication waiver (http://creativecommons.org/publicdomain/zero/1.0/) applies to the data made available in this article, unless otherwise stated in a credit line to the data.
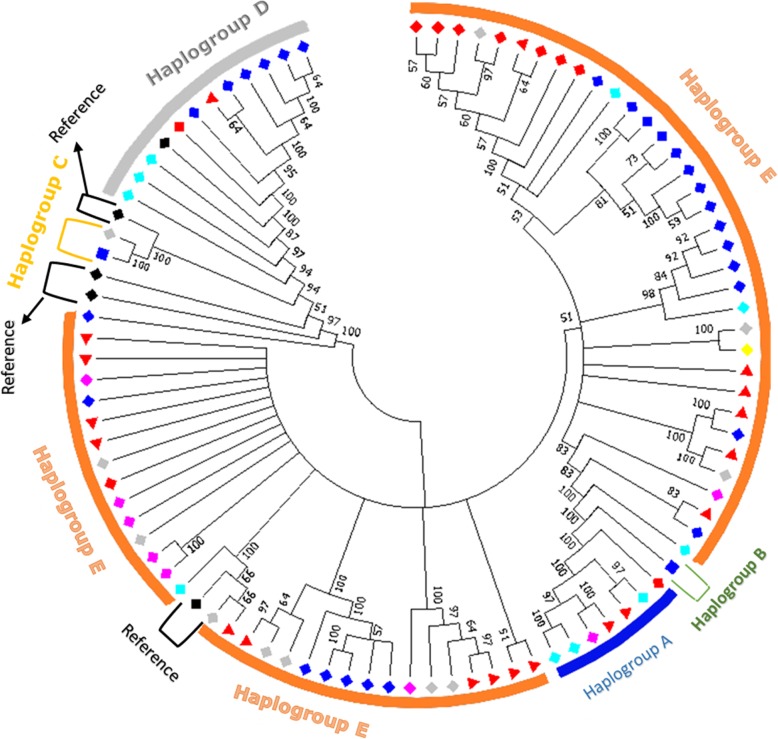
 = Iraqi haplotypes,
  = Ethiopian haplotypes,
  = Algerian haplotypes,
  = Saudi haplotypes,
  = Pakistani haplotypes,
  = Libyan haplotypes,
  = Ethiopian haplotype with reference,
  = References,
  = common haplotypes among countries. Numbers on nodes represent bootstrap values
