
Figure 2.
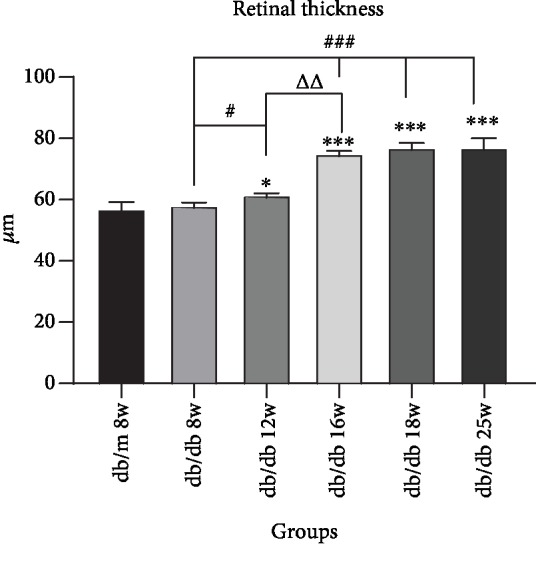
Augments of retina thickness in sequential diabetic mouse retinas. Annotation: compared with db/m mice at 8 weeks: ∗P < 0.05, ∗∗P < 0.01; compared with the last db/db mouse group: ΔP < 0.05, ΔΔP < 0.01.
Official websites use .gov
A
.gov website belongs to an official
government organization in the United States.
Secure .gov websites use HTTPS
A lock (
) or https:// means you've safely
connected to the .gov website. Share sensitive
information only on official, secure websites.
Augments of retina thickness in sequential diabetic mouse retinas. Annotation: compared with db/m mice at 8 weeks: ∗P < 0.05, ∗∗P < 0.01; compared with the last db/db mouse group: ΔP < 0.05, ΔΔP < 0.01.