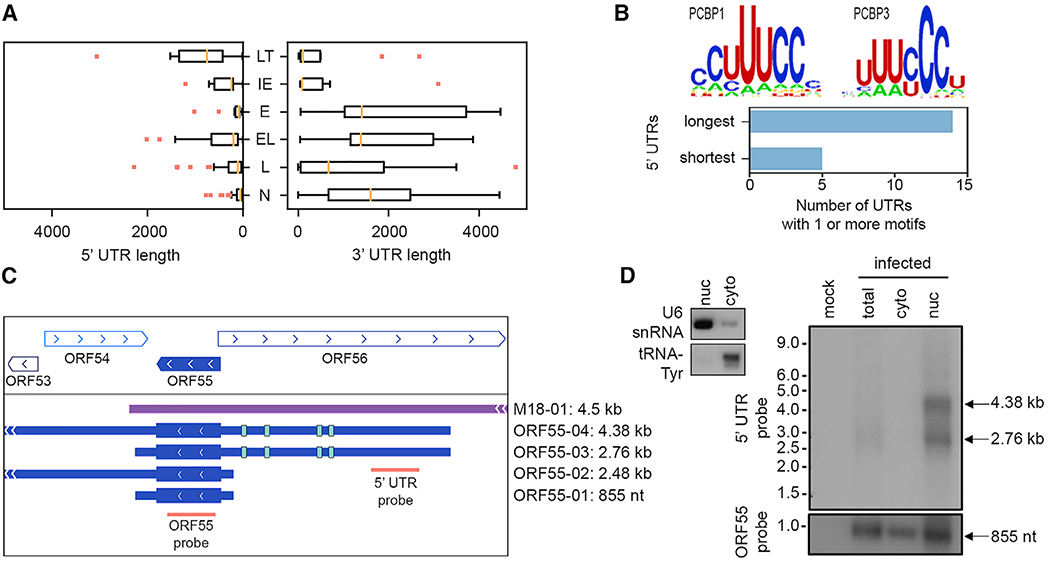
Figure 4. MHV68 Transcript 5′ and 3′ UTR Diversity.
(A) Lengths of 5′ and 3′ UTRs by class. LT, latent; IE, immediate early; E, early; EL, early-late; L, late; N, non-GenBank. Analysis based on 3 sequencing methods of 1 biological replicate.
(B) PCBP1 and PCBP3 binding motifs and enrichment in PCBP binding motifs in longest 5′ UTRs relative to shortest 5′ UTRs.
(C) ORF55 transcripts with long and short UTRs. The green bands indicate the locations of the PCBP motifs.
(D) Northern blot of total, cytoplasmic, and nuclear lysates using probes targeting transcripts containing the ORF55 ORF sequence or the ORF55 long 5′ UTR. Control probes are for nuclear (U6 small nuclear RNA [snRNA]) and cytoplasmic (tRNA-Tyr) RNA. Representative of 2 biological replicates.

