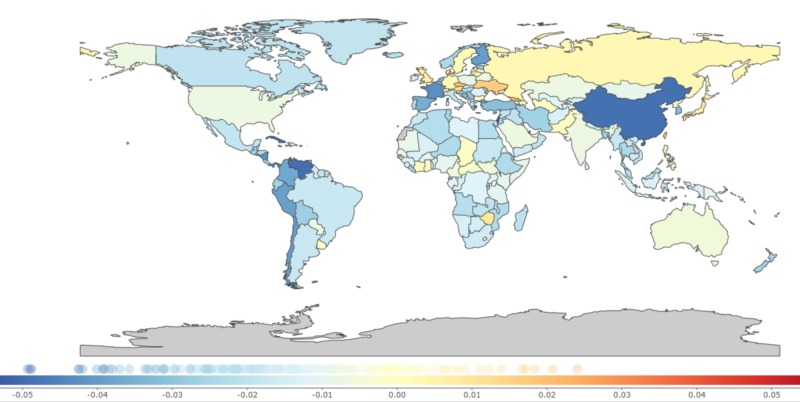
Figure 2. Annual percentage change in age-standardized years of life lost due to the adverse effects of medical treatment, 1990-2017.
0.01 on the color bar graph indicates a 1% annual increase of years of life lost per 100,000 population from 1990 to 2017 and -0.01 indicates a -1% annual decrease of years of life lost per 100,000 population from 1990 to 2017 [9].

