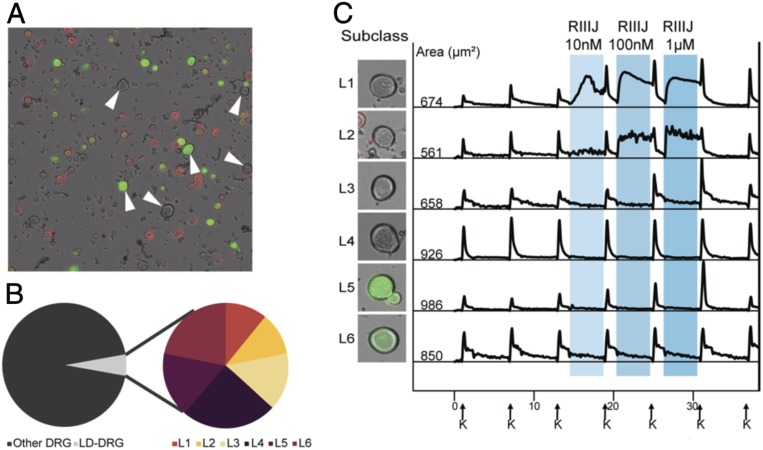
Fig. 1.
L-DRG neurons, identified initially by size of cell soma, are subdivided by response to RIIIJ and expression of CGRP. (A) Dissociated mouse DRG neurons from CGRP-GFP reporter mice. Bright-field image is overlaid with fluorescent images obtained from IB4 (red) staining and GFP expression (green). IB4 is conjugated to Alexa-Fluor 568 dye (red). The ring staining is indicative of IB4 binding to an extracellular target on the plasma membrane of live cells (nonpeptidergic nociceptors). Soluble GFP is expressed throughout the cytosol of CGRP-expressing neurons (peptidergic nociceptors). Neurons with cross-sectional cell area >500 µm2 and lacking IB4 stain are reliably identified as l-DRG neurons (indicated by arrows). (B) l-DRG neurons make up only 5.5% of the DRG neuronal population. Each subclass of l-drg neurons makes up between 0.6 and 1.3% of the population. (C) l-DRG neurons are subdivided into six subclasses based on the responses to the application of RIIIJ and CGRP-GFP expression. Intracellular calcium profiles (340/380 nm) were obtained from six neurons representative of each group. L1: application of RIIIJ provoked a rise in [Ca2+]i. A smooth rise in [Ca2+]i is observed that either continues to rise or rises and falls over the course of minutes, sometimes rising more than once. L2: RIIIJ provoked an immediate rise in [Ca2+]i. In contrast to L1, the calcium profiles of these neurons exhibit a “jagged” phenotype that lasts until RIIIJ is removed. Calcium levels stay elevated throughout the RIIIJ incubation but fluctuate between rising and falling several times over a 5-s period. L3: an amplified response (higher peak) to the depolarizing stimulus (high extracellular K+) following incubation with RIIIJ. L4: no response to the application of RIIIJ during or following the peptide application. L5: expressed CGRP-GFP and responded to RIIIJ similarly to L3 neurons. L6: expressed CGRP-GFP and did not respond to the application of RIIIJ. Left shows the bright-field image overlaid with the GFP fluorescence of the neuron from which the data were acquired. Numbers indicate the cross-sectional area of each cell soma in micrometers2. On the x axis (time in minutes), arrows indicate 15-s applications of 20 mM K+ at 7-min intervals. Shaded areas represent the presence of different concentrations of RIIIJ. On the y axis, the ratio of 340/380 nm as a measure of relative intracellular calcium levels is normalized to a scale of zero to one.

