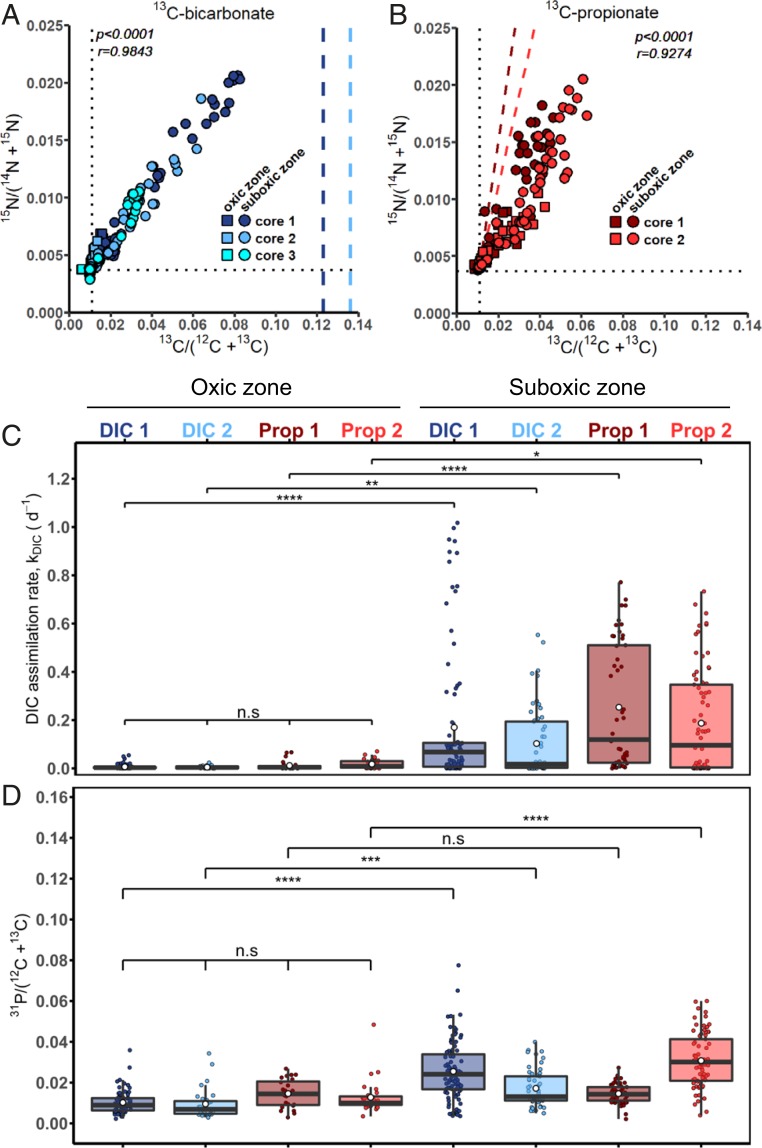
Fig. 1.
Assimilation of 13C- and 15N-labeled substrates by cable bacteria as measured by NanoSIMS. Shown are atom fractions in incubations with (A) 13C-bicarbonate (n = 347) and (B) 13C-propionate (n = 177). Each data point represents the mean 13C and 15N atom fraction for a segment (5 to 10 cells), or in some cases from multiple segments (16 to 65 cells), from an individual filament (see example images in SI Appendix, Fig. S1). Pearson correlation coefficient (r) and the corresponding P value are also shown. Colors and symbols differentiate between replicate sediment cores and redox zones in the sediment from which the filaments were retrieved, respectively. Dotted lines represent the natural 13C (0.011) and 15N (0.0037) atom fraction measured in filaments with no exposure to labeled substrates. Dashed lines in A show the 13C atom fraction in the DIC pool during the incubation. Dashed lines in B show the predicted 13C atom fraction in the filament segments due to assimilation of 13C-bicarbonate produced in the sediment by mineralization of the 13C-propionate by other community members (SI Appendix, Methods). (C) Boxplot of the inorganic carbon assimilation rates, kDIC (d−1). Each data point represents the value calculated for the same segment, or multiple segments, as the 13C and 15N atom fractions data shown in A and B. Segments were grouped based on the redox zone (oxic vs. suboxic), treatment (13C-bicarbonate vs. 13C-propionate), and core replicates. For one 13C-bicarbonate incubation (cyan circles in Fig. 1A), assimilation rates could not be calculated due to the lack of porewater 13C-DIC data. For the 13C-propionate incubations, the bicarbonate assimilation rates were estimated from the 15N enrichments (SI Appendix, Methods), and the corresponding propionate assimilation rates are shown in SI Appendix, Fig. S2. White circles and horizontal lines show the mean and median assimilation rate, respectively. P values indicate significant differences between redox zones within the same replicate core; n.s., P ≥ 0.05 (not significant); *P < 0.05; **P < 0.01; ***P < 0.001; ****P < 0.0001. (D) Boxplot of the relative phosphorus content in cable bacterium filaments expressed as the 31P/C ion count ratio. Each data point represents the value calculated for the same segment, or multiple segments, as the 13C and 15N atom fractions data shown in A and B. Grouping of the segments, as well as the meaning of the P values and symbols used, is the same as in C. The values of the 13C and 15N atom fractions and the 31P/C ion count ratio’s for each segment used in this figure can be found in Dataset S1.

