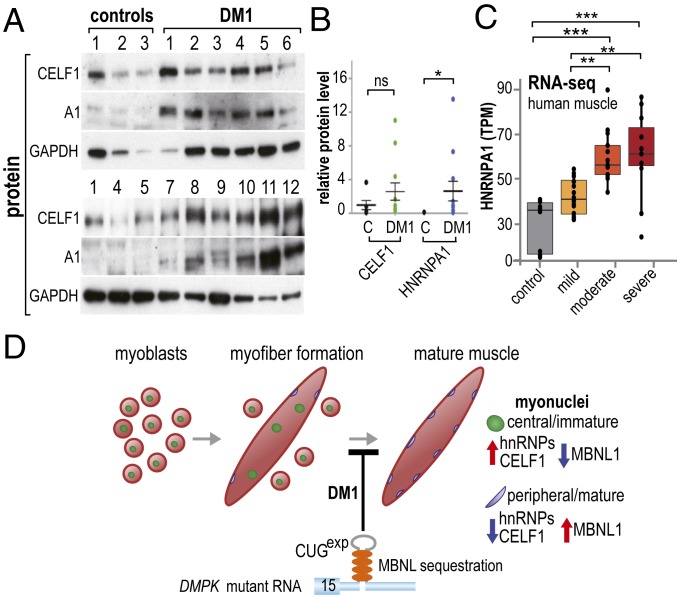
Fig. 6.
Up-regulation of both HNRNPA1 and CELF1 in DM1 muscle. (A) Immunoblots of control (n = 5) and DM1 (n = 12) muscle biopsy samples (GAPDH, loading control). (B) Quantitative analysis of relative protein levels (CELF/GAPDH, HNRNPA1/GAPDH) between control (C) and DM1 muscle biopsies. Note the very low level of HNRNPA1 in control adult muscles. P values were calculated using unpaired one-tailed Student’s t test. Data are SEM and significant. *P = 0.0268. (C) Box plots of HNRNPA1 mRNA levels (transcripts per million, TPM) in tibialis anterior muscle biopsies from control or DM1 patients. DM1 patients were classified as mild, moderate, or severe, as previously described (47). Patient RNA-seq data were acquired from the Myotonic Dystrophy Deep Sequencing Data Repository (http://www.dmseq.org/). P values were calculated using a one-way ANOVA with Tukey’s HSD post hoc test. Data are SEM and significant. **P < 0.01; ***P < 0.001. (D) Model for RBP misregulation in DM1 pathogenesis. Normally, myoblasts (Left, red circles with green central/immature nuclei) fuse to form immature myofibers (Middle, red ellipsoid) followed by nuclear migration to the subsarcolemmal region resulting in mature myofibers (Right, blue peripheral/mature nuclei). In DM1, the CUG expansion (gray hairpin in DMPK 3′ UTR) inhibits this normal differentiation process so DM1 myofibers are characterized by centralized myonuclei. At the molecular level, MBNL (orange ovals) splicing activity is down-regulated (blue arrow) due to sequestration by CUGexp RNAs, while hnRNPs and CELF1 are up-regulated (red arrow) either at the transcriptional (HNRNPA1) or posttranslational (CELF1) levels, leading to coordinate misregulation of these RNA splicing factors and DM1 spliceopathy.

