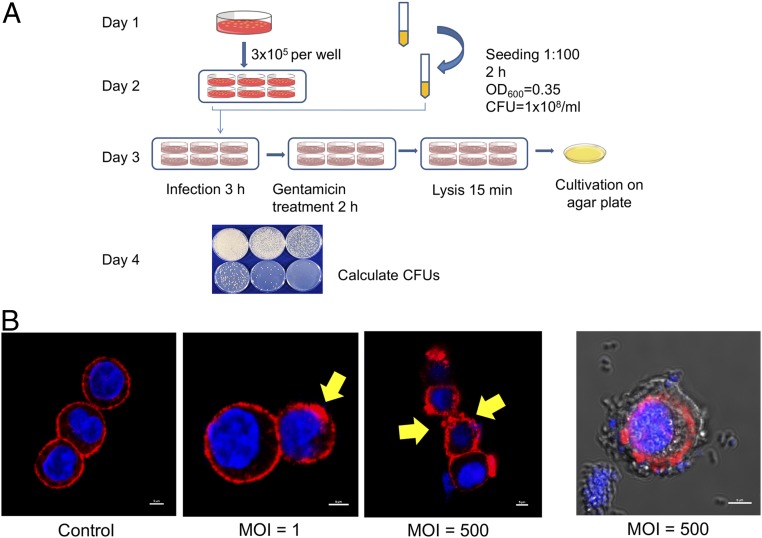
Fig. 3.
EPEC infection of Caco-2 cells. (A) Schematic workflow showing the measurement of infectivity of EPEC. (B) EPEC infections at different MOI values show clear signs of disruption of the actin structure of Caco-2 cells. Shown is a representative image demonstrating EPEC attachment on Caco-2 cells at an MOI of 500. Blue indicates DAPI staining for cell nuclei; red, AF647 phalloidin for actin. Actin was labeled with Alexa Fluor 647 phalloidin, and nuclei were labeled with DAPI.

