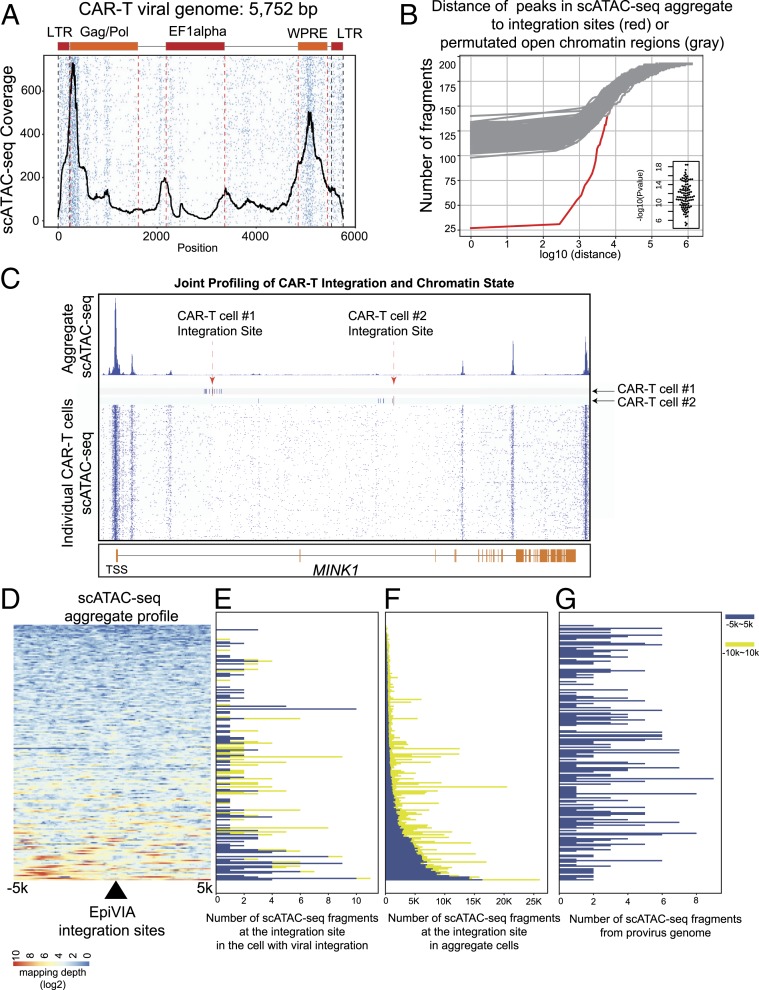
Fig. 4.
Chromatin state of provirus sequence and host genome at integration sites. (A) Heatmap demonstrates the accessibility of different regulatory elements in the provirus genome at single-cell level. The average profile at the viral genome is depicted in black. (B) Accumulative distribution demonstrates distance between identified chimeric fragments to the peaks in aggregated scATAC-seq (red) in comparison with the distance between permuted open chromatin fragments to peaks in the aggregated scATAC-seq (gray), with the P value calculated with Wilcoxon rank-sum test. (C) Host chromatin accessibility of a gene with two independent integration events in two individual CAR-T cells. Genome browser view depicts MINK1 locus with CAR-T integration sites identified by EpiVIA in two single CAR-T cells together with scATAC-seq data across all single cells. Red arrows indicate the CAR-T integration sites and navy blue bars represent genomic locations of scATAC-seq fragments in two single CAR-T cells. Heatmap depicts the scATAC-seq fragments across all CAR-T cells. (D) Heatmap demonstrates mapping depth of aggregated scATAC-seq data in the 10-kb host genome centered on EpiVIA’s single-cell integration sites. The integration sites are sorted by the average mapping depth in this region. (E) Bar plot demonstrates the number of host fragments within 5 and 10 kb of integration sites in the cell that harbor the integration site. The integration sites are sorted in the same order as in D. (F) Bar plot demonstrates the total number of host fragments within 5 and 10 kb of integration sites across all single cells. The integration sites are sorted in the same order as in D. (G) Bar plot demonstrates the number of scATAC-seq fragments in the proviral genome from the cell that have the integration site. The integration sites are sorted in the same order as in D.

