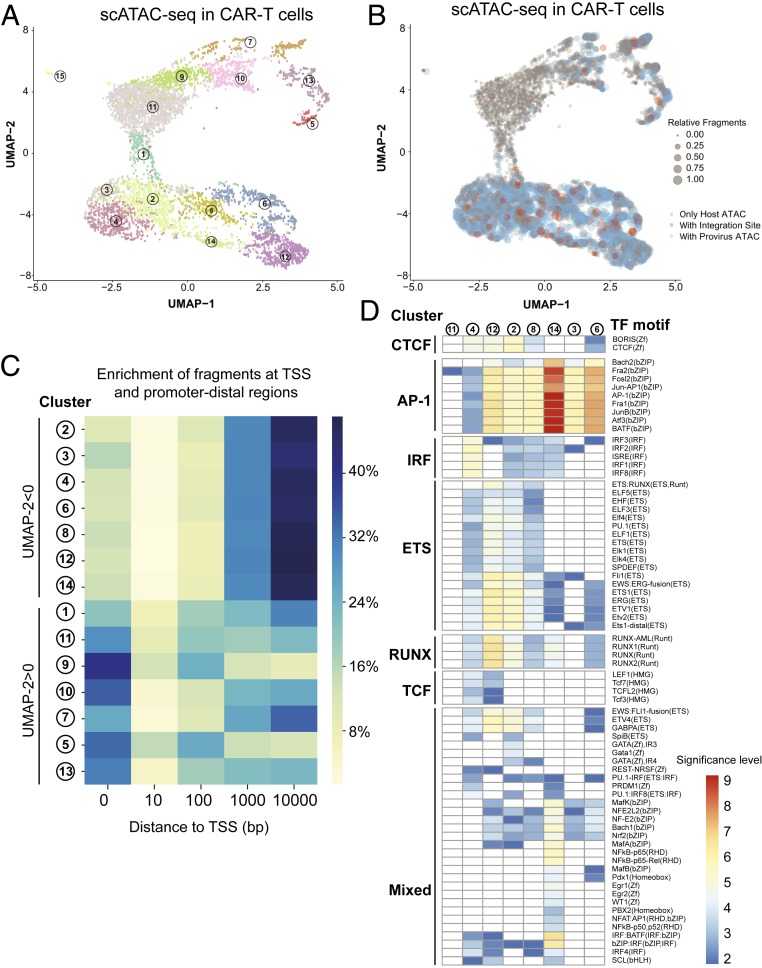
Fig. 5.
Single-cell chromatin state of the host genome. (A) UMAP projection of scATAC-seq profiles of CAR+ CD8 T cells. Dots represent individual cells and the colors indicate the cluster of the cell identified by Snap-ATAC (35). (B) UMAP projection of scATAC-seq profiles of CAR+ CD8 T cells. The colors indicate integration site or provirus fragments present in individual cells, and the size of the dots suggests the number of fragments sequenced in the cell. (C) Heatmap visualization of distance of peaks in each cluster to the closest TSS. (D) Heatmap representation of enrichment level of transcription factor (TF) motifs in the unique peaks of each cluster. CTCF, CCCTC-binding factor; ETS, ETS proto-oncogene 1, transcription factor; IRF, interferon regulatory factor; RUNX, runt-related transcription factor (RUNX); and TCF, T cell factor.

