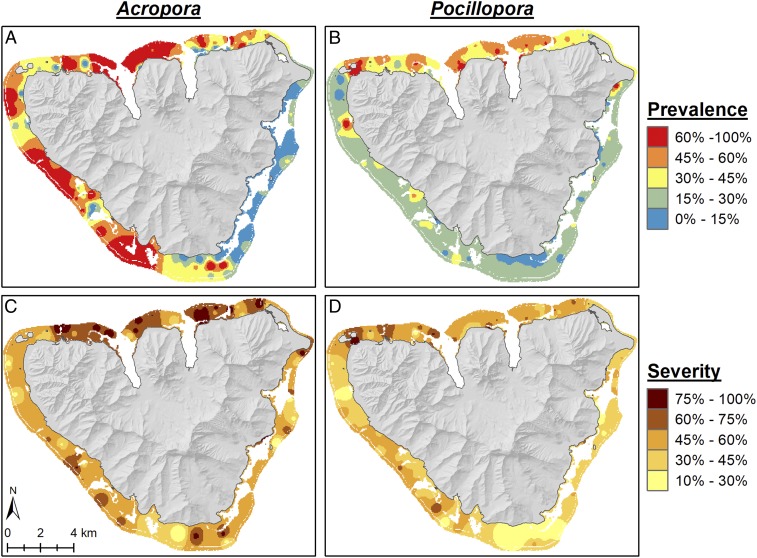
Fig. 3.
(A–D) Distribution of coral bleaching prevalence (A and B) and severity (C and D) for Acropora (A and C) and Pocillopora (B and D). Continuous surfaces were created using inverse distance weighting; the extent of the surface represents reef area within the lagoons, while white areas represent nonreef area (e.g., deep lagoons, sand) within lagoons or offshore reefs beyond the reef crest. Note that color ramps are different for prevalence and severity.

