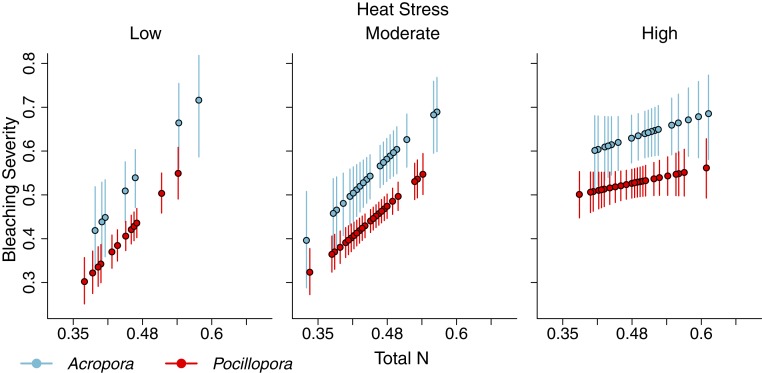
Fig. 5.
Visualization of the negative interaction between nitrogen and heat stress on bleaching severity for Acropora (blue) and Pocillopora (red) in the back reef. Plotted are the mean values (circles) and 95% credible intervals (lines) predicted from the models for bleaching severity across the range of nitrogen values when heat stress was held to a low (1.84 °C weeks), a moderate (2.14 °C weeks), and a high value (2.81 °C weeks).

