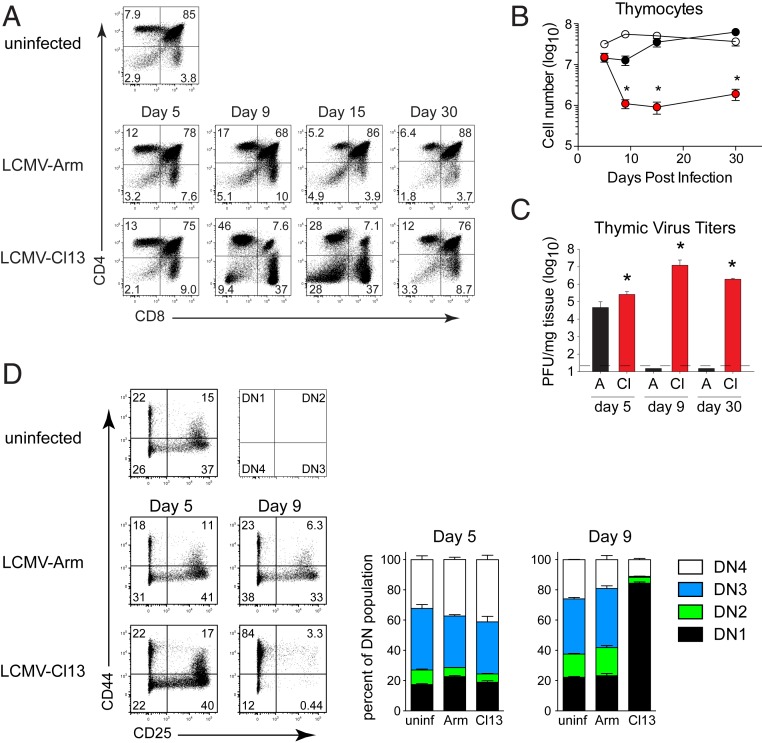
Fig. 1.
Thymic depletion during chronic LCMV-Cl13 infection. (A) Mice were infected with LCMV-Arm or LCMV-Cl13 and euthanized in parallel with uninfected control mice at the indicated day after infection and stained for CD4 and CD8 expression. (B) The total number of thymocytes in uninfected mice (open circles), LCMV-Arm infected mice (black circles), or LCMV-Cl13 infected mice (red circles). (C) Bar graphs indicate thymus viral titers (plaque-forming units; PFU) at the indicated day in LCMV-Arm (A, black) and LCMV-Cl13 (Cl, red) infected mice. Dotted line indicates the levels of detection. (D) Flow plots and stacked bar graphs indicate the percentage of double negative thymocytes in the DN1, DN2, DN3, and DN4 stages of development in uninfected, or day 5 and day 9 after LCMV-Arm or LCMV-Cl13 infection. Cells are gated on double negative thymoctyes. Data are representative of two to four independent experiments with three to five mice per group. Error bars indicate SD (SD). *P < 0.05.

