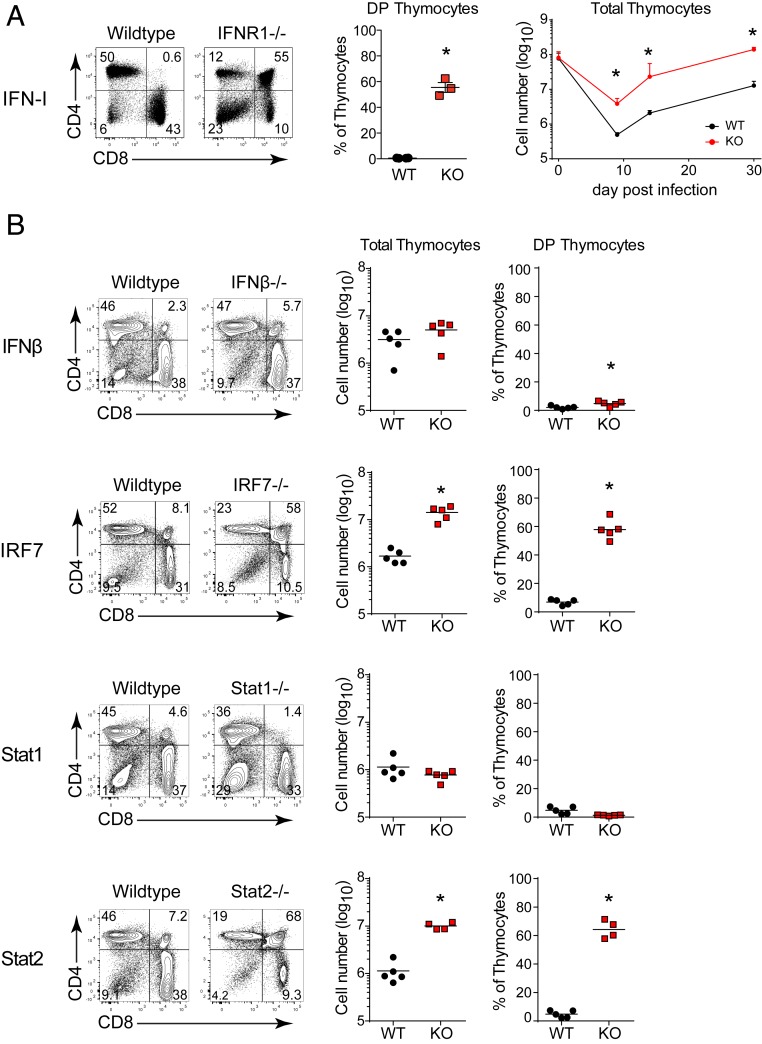
Fig. 4.
IFN-I in chronic infection drives thymus depletion. (A) Flow plots show the thymus profile, and the bar graphs indicate the percent of double positive thymocytes or of total thymocytes in WT and IFNR−/− mice on day 9 after infection. (B) Flow plots show the CD4 vs. CD8 thymus profile and scatter plots the percent of DP thymocytes or total thymic cellularity on day 9 after LCMV-Cl13 infection of WT, IFNβ−/−, IRF7−/−, Stat1−/−, or Stat2−/− mice. Data are representative of three to five independent experiments with three to five mice per group. Error bars indicate SD. *P < 0.05.

