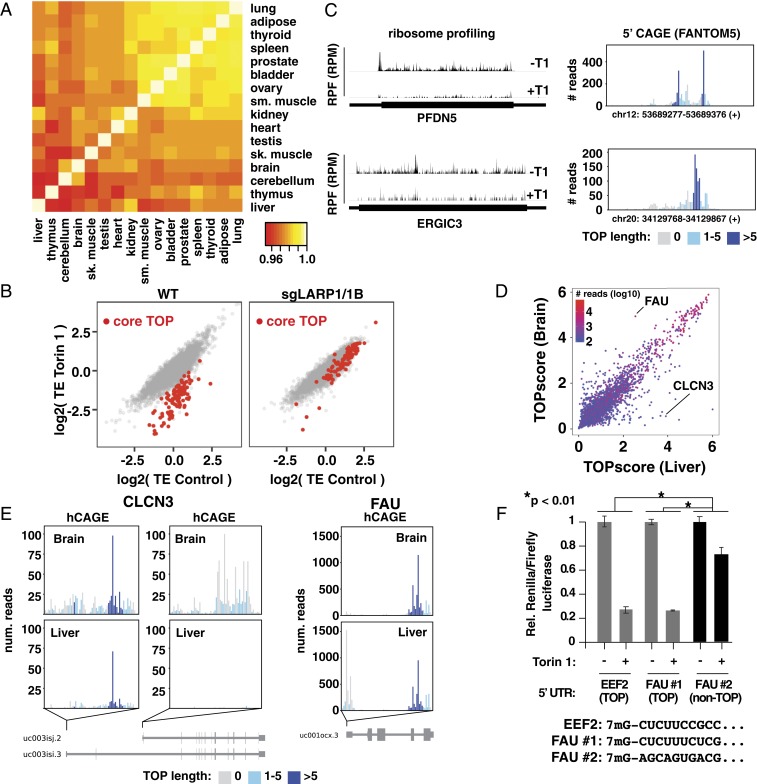
Fig. 4.
Variation of TOP motifs across tissues. (A) TOPscores are highly correlated across tissues. Heat map shows Pearson correlations from pairwise comparison of TOPscores for 3,241 mRNAs with >100 peak reads from indicated tissues (further details provided in Methods). (B) mTOR controls “core” TOP mRNAs via LARP1. Translation efficiencies (TEs) in control and Torin 1-treated conditions in WT and sgLARP1/1B HEK-293T cells. Core TOP mRNAs (see text) are indicated in red. (C) Ribosome footprints and hCAGE data for two “core” TOP mRNAs. (Left) Ribosome footprints from Torin 1-treated (+T1) and control (−T1) HEK293T cells for the indicated transcripts. (Right) hCAGE peaks (HEK293 cells) for the same genes. (D) Comparison of TOPscores in liver and brain. Data are colored according to the lowest number of hCAGE peak reads between these two tissues. (E) Genes producing TOP and non-TOP isoforms in brain and liver. hCAGE peaks for the indicated genes for liver and brain. (F) Alternative FAU TSSs are differently mTOR-regulated. A control plasmid encoding firefly luciferase and a test plasmid encoding Renilla luciferase and the 5′ UTR from either Eef2 (mouse), FAU TSS no. 1 (hg38, chr11:65122134), or FAU TSS no. 2 (hg38, chr11:65122188; human) with the indicated 5′ sequences were transfected into WT HEK-293T cells and incubated overnight. Cells were then treated with 250 nM Torin 1 for 2 h and analyzed for luciferase levels (n = 3; error bars are SD, significance by ANOVA).

