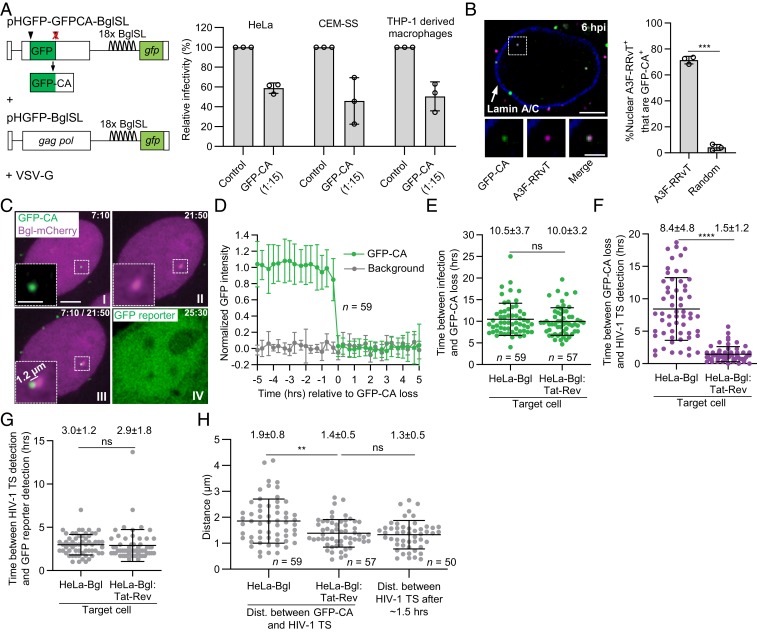
Fig. 1.
GFP-CA–labeled viral complexes uncoat in the nucleus within ∼1.5 µm of HIV-1 transcription sites. (A) HIV-1 vectors (Left) used to produce GFP-CA–labeled virions with high infectivity in HeLa, CEM-SS, and THP-1–derived macrophages (Right) compared to unlabeled control virions (set to 100%). (B) Nucleus of a HeLa cell infected with virions colabeled with GFP-CA + A3F-RRvT and immunostained with anti-Lamin A/C antibody (Left). Most nuclear A3F-RRvT viral complexes (∼70%) have detectable GFP-CA signals 6-h postinfection (hpi) compared to random locations in the nucleus (Right). (C) Representative live-cell microscopy images of a HeLa-Bgl cell infected with GFP-CA–labeled virions. A GFP-CA–labeled nuclear viral complex uncoated and lost the GFP-CA signal 7:10 hpi (I) and HIV-1 TS appeared near the site of GFP-CA disappearance 21:50 hpi (II). The HIV-1 TS appeared 1.2 µm from the GFP-CA signal (III). GFP reporter expression detected 25:30 hpi (IV). (D) Average normalized GFP-CA intensities are stable before abrupt GFP-CA loss within a single frame (<20 min). (E) Time between infection and nuclear GFP-CA loss, (F) nuclear GFP-CA loss and HIV-1 TS appearance, and (G) HIV-1 TS appearance and gfp reporter detection for 59 and 57 infectious GFP-CA–labeled viral complexes in HeLa-Bgl cells and HeLa-Bgl:Tat-Rev cells, respectively. (H) Distance between GFP-CA signal (time point prior to GFP-CA loss) and HIV-1 TS (first time point of detection) in HeLa-Bgl cells (∼8.4 h) and HeLa-Bgl:Tat-Rev cells (∼1.5 h) compared to HIV-1 TS movements in ∼1.5 h. (Scale bars, 5 µm; Inset, 2 µm.) For A and B, data are mean ± SD from three independent experiments; P values are from paired t tests. For (E–H), lines are mean ± SD; P values are from Welch’s t tests. ****P < 0.0001; ***P < 0.001; **P < 0.01; *P < 0.05; ns, not significant (P > 0.05).

