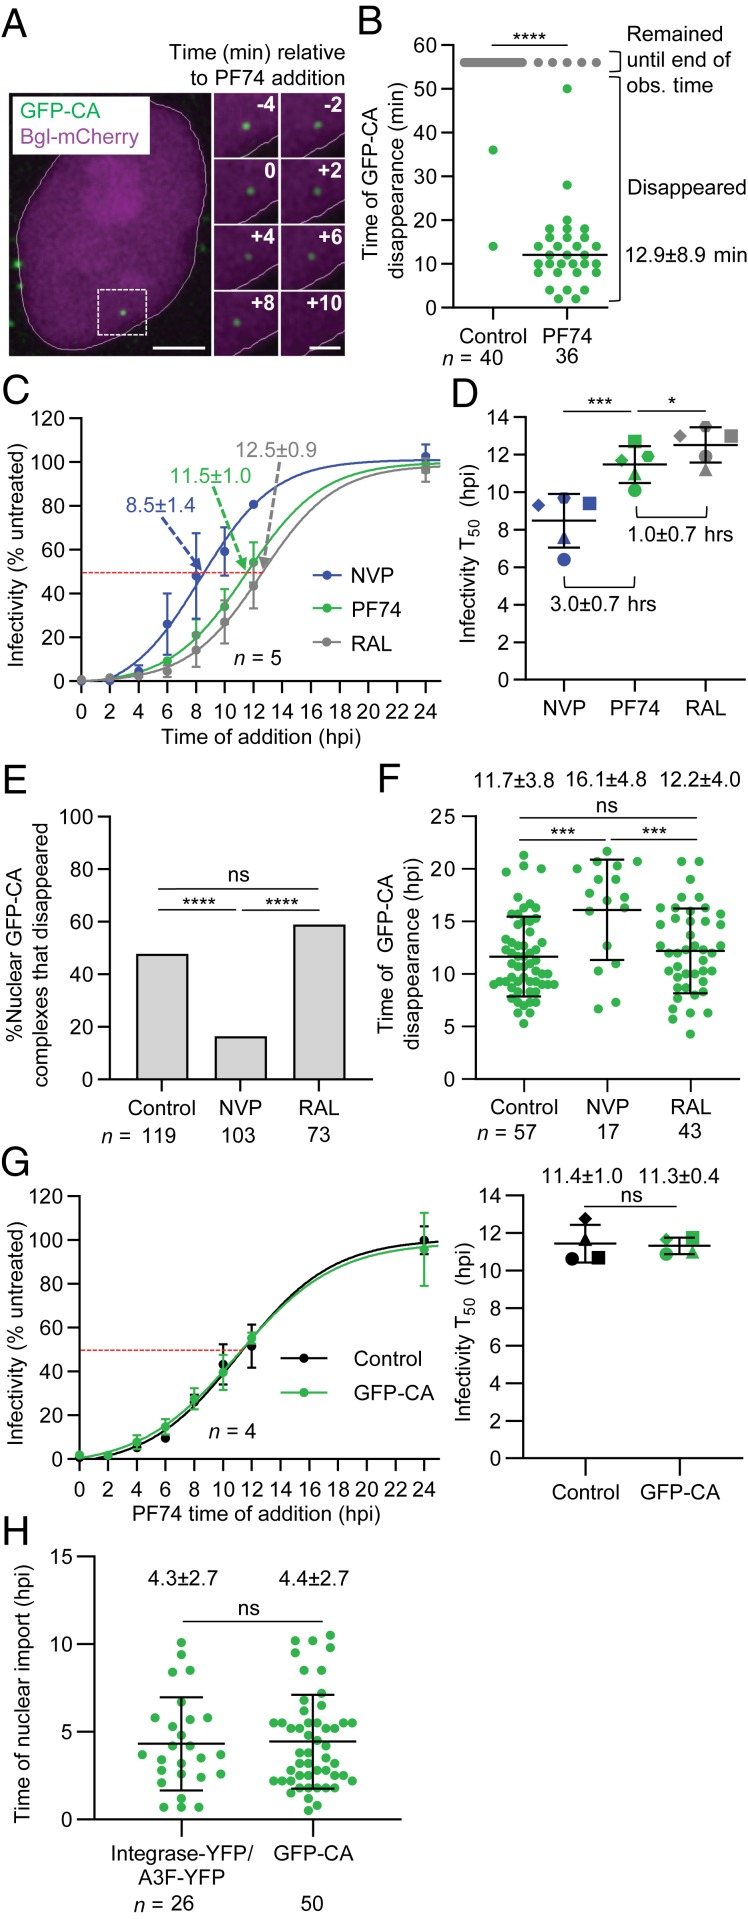
Fig. 2.
Determination of the sensitivity of nuclear GFP-CA–labeled viral complexes to capsid, reverse transcriptase and integrase inhibitors. (A) Representative live-cell microscopy images of a nuclear GFP-CA–labeled viral complex before and after addition of PF74 (10 µM). Numbers in white indicate time (min) relative to the time of PF74 addition. (Scale bar, 5 µm; Inset, 2 µm.) (B) Time of disappearance of GFP-CA–labeled viral complexes in untreated control cells and PF74-treated cells during ∼1-h observation time. (C) Time-of-addition assays with NVP, PF74, or RAL. The numbers indicate the time at which 50% of the viral complexes became resistant to the inhibitors (infectivity T50). (D) Comparison of average infectivity T50 for NVP, PF74, and RAL from five independent experiments. (E) Proportion of nuclear GFP-CA–labeled complexes that disappeared during the observation time (21.6 hpi). (F) Average time of GFP-CA disappearance. Lines are mean ± SD; P values are from Welch’s t tests. (G) PF74 time-of-addition assays with GFP-CA–labeled and unlabeled virions. Comparison of average time at which 50% of the viral complexes became resistant to PF74 (infectivity T50) from four independent experiments (Right). (H) Comparison of the time of nuclear import previously determined for integrase-YFP- or A3F-YFP-labeled viral complexes (14) and GFP-CA–labeled viral complexes. For B and E, P values are from Fisher’s exact tests comparing the proportion nuclear GFP-CA complexes that disappeared. For D and G, lines are mean ± SD; P values are from paired t tests. ****P < 0.0001; ***P < 0.001; *P < 0.05; ns, not significant (P > 0.05).

