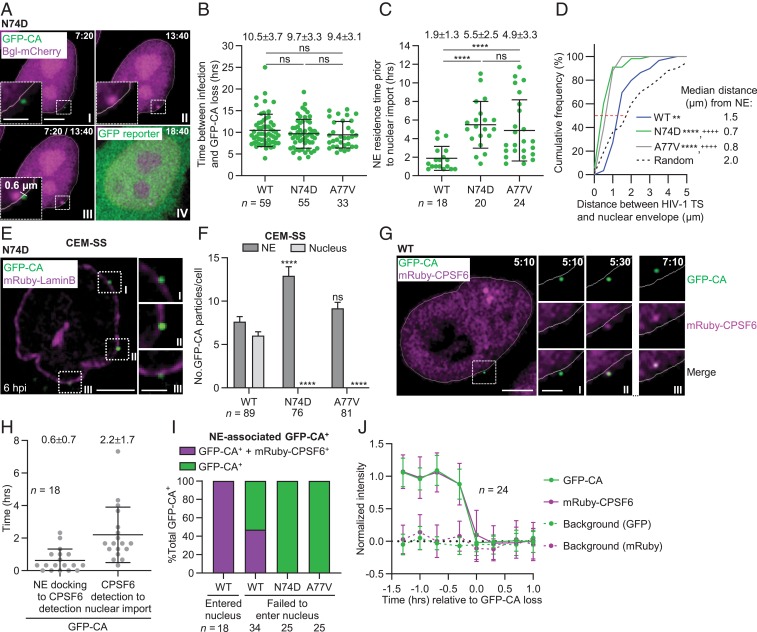
Fig. 4.
CA-CPSF6 interaction at the NE facilitates nuclear import of viral complexes, the location of their uncoating, and the location of HIV-1 TS. (A) Representative live-cell microscopy images of a HeLa-Bgl cell infected with GFP-CA–labeled virions of CA mutant N74D. A GFP-CA–labeled viral complex uncoated at the edge of the nuclear Bgl-mCherry signal, 7:20 hpi (I) and HIV-1 TS appeared near the site of GFP-CA disappearance 13:40 hpi (II). The HIV-1 TS appeared 0.6 µm from the GFP-CA signal (III). GFP reporter expression detected 18:40 hpi (IV). (B) Time between infection and GFP-CA loss; data for WT the same as in Fig. 1E. Lines are mean ± SD; P values are from Welch’s t tests. (C) NE residence time of GFP-CA–labeled viral complexes prior to nuclear import. For N74D/A77V mutants, the time of nuclear import was assumed to occur at the time of GFP-CA loss (i.e., uncoating). (D) Cumulative frequency distribution of distances (µm) between HIV-1 TS and NE and random sites in the nuclei to NE; median distances are indicated by the red dotted line. P values are from Kolmogorov–Smirnov tests. **P < 0.01 compared to random; ****P < 0.0001 compared to random; ++++P < 0.0001 compared to WT. (E) N74D GFP-CA–labeled viral complexes localize to the NE but not in the nuclei of CEM-SS cells. (F) Quantitation of GFP-CA–labeled viral complexes at the NE and in the nucleus. Data are pooled from three independent infections (n = number of cells analyzed); P values are from paired t tests. ****P < 0.0001; ns, not significant (P > 0.05). (G) Representative live-cell microscopy images of infected HeLa:mRuby-CPSF6 cells show mRuby-CPSF6 recruitment to a GFP-CA–labeled viral complex located at or near the NE (I and II); dual-labeled GFP-CA and mRuby-CPSF6 complexes are imported into the nucleus (III). (H) Time between NE docking to CPSF6 detection and CPSF6 detection to nuclear import for 18 GFP-CA–labeled viral complexes. Lines are mean ± SD (I) Proportion of NE-associated GFP-CA+ viral complexes that are CPSF6+. The viral complexes that entered the nucleus during the observation time and those that were docked at the NE but failed to enter the nucleus were analyzed. (J) Simultaneous disappearance of intranuclear GFP-CA and mRuby-CPSF6 signals. (Scale bars, 5 µm; Inset, 2 µm.)

