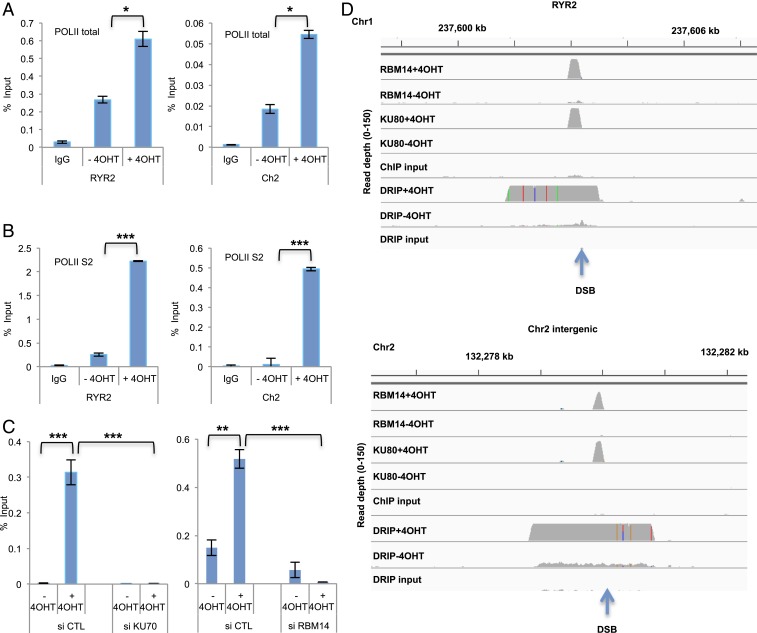
Fig. 3.
RNAPII is recruited to DSB sites and RNA:DNA hybrids are generated around DSB sites. (A) Accumulation of total (POLII-total) and (B) active (POLII-S2) RNAPII before I-PpoI activation (−4OHT) and after I-PpoI activation (+4OHT) at two individual I-PpoI sites, (RYR2 site, Chr2 intergenic site). The bar plot shows the percentage of enrichment relative to the input of total RNAPII and RNAPII-S2 associated with genomic DNA detected by primers near the I-PpoI sites. Data shown are representative of three independent experiments. Each experiment was performed in triplicate. *P < 0.05 by two-tailed t test. (C) Effects of KU70 (Left) and RBM14 (Right) knockdown on the recruitment of RNAPII. Accumulation of total (POLII-total) RNAPII before I-PpoI activation (−4OHT) and after I-PpoI activation (+4OHT) at RYR2 I-PpoI site is shown. The bar plot shows the percentage of enrichment relative to the input of total RNAPII associated with genomic DNA detected by primers near the I-PpoI sites. Data shown are representative of three independent experiments. Each experiment was performed in triplicate. **P < 0.01, ***P < 0.001 by two-tailed t test. (D) Genome browser screenshot representing DRIP-seq, RBM14 ChIP-seq, and KU80 ChIP-seq before I-PpoI activation (−4OHT) and after I-PpoI activation (+4OHT) at two individual I-PpoI sites (RYR2 site, Chr2 intergenic site).

