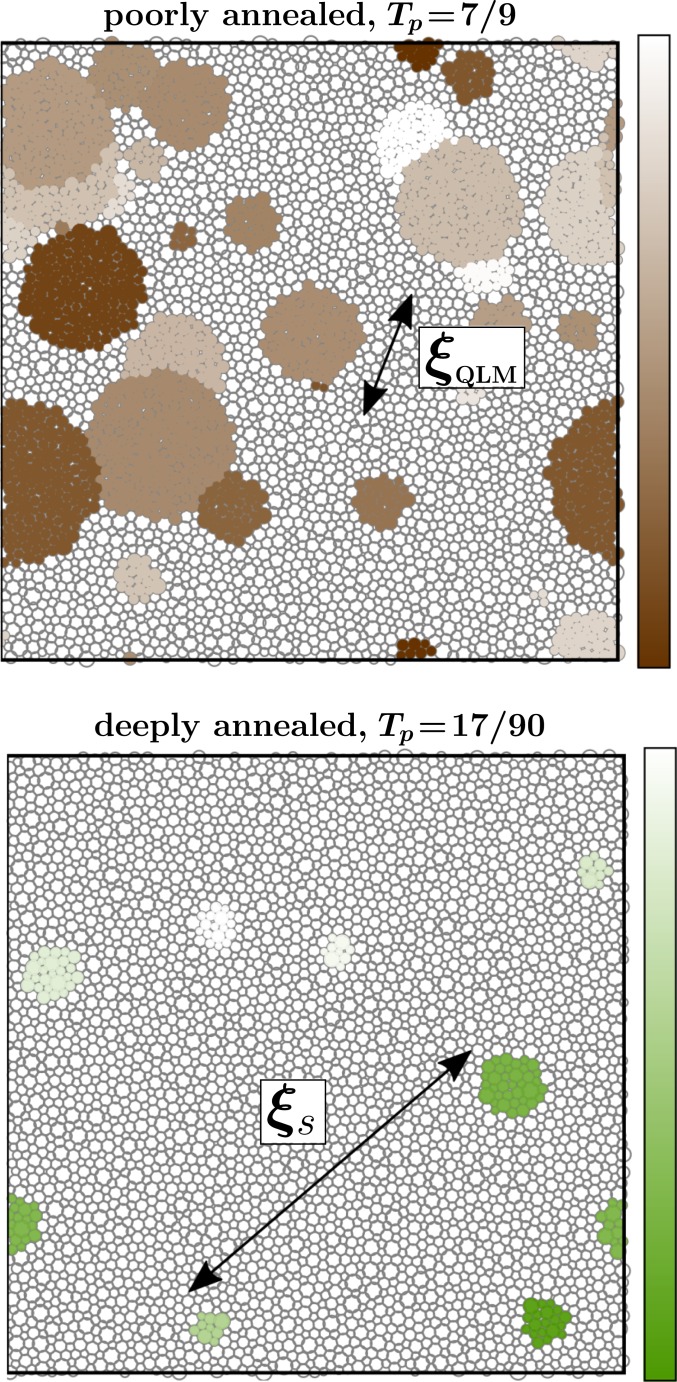
Fig. 1.
A graphical representation of the population of QLMs in poorly annealed (Upper) and deeply annealed (Lower) two-dimensional computer glasses. Each blob represents a QLM; its size is proportional to our estimation of the mode’s core size , and the color code represents the mode’s frequency, decreasing from bright to dark; the Upper (Lower) color code range is [0.18, 0.42] , expressed in terms of , with being the high- shear wave speed, and is the interparticle distance. The typical distance between QLMs, , is also marked. Details of the calculation can be found in SI Appendix. Note that the deeply annealed case shown in Lower might be representative of laboratory molecular or metallic glasses.

