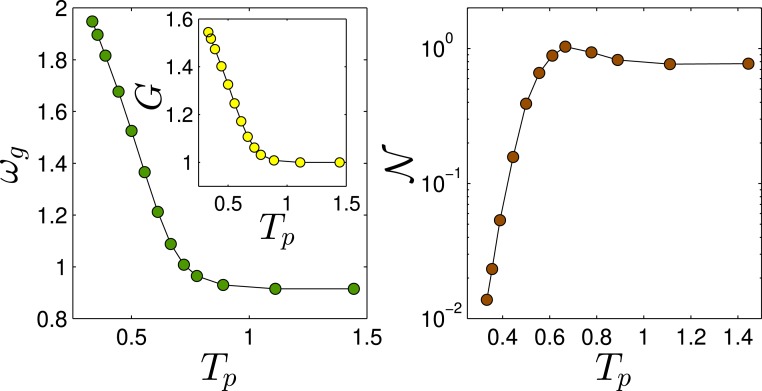
Fig. 4.
(Left) The characteristic frequency of QLMs, estimated by the pinching procedure discussed in the text, plotted vs. the parent temperature . (Left, Inset) The sample-to-sample mean athermal shear modulus, , plotted against . (Right) is proportional to the number of QLMs and is plotted here against .

