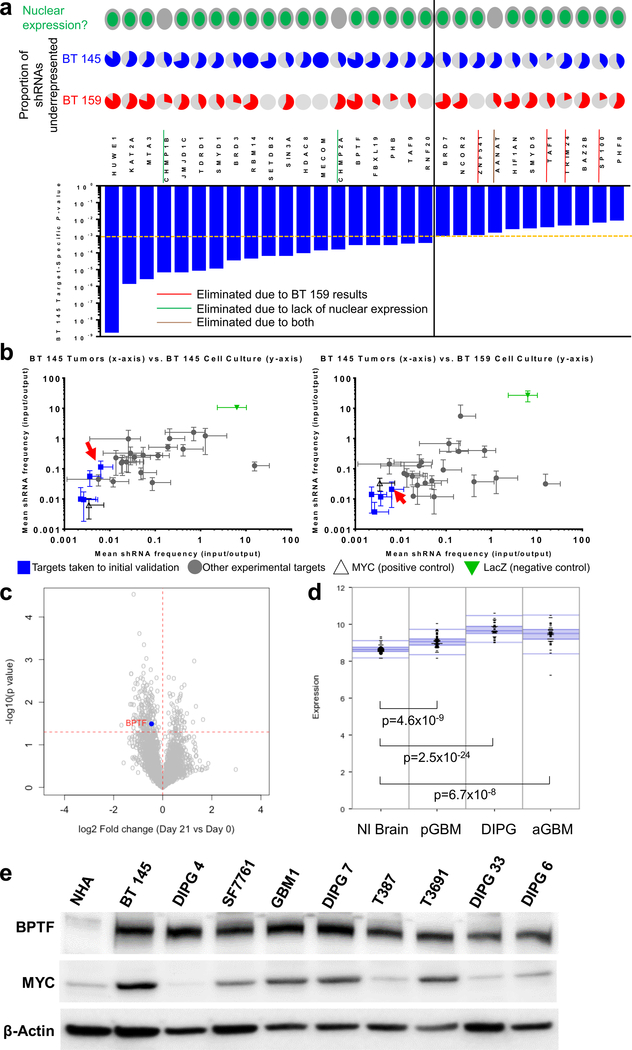
Figure 1:
Justification for BPTF investigation in GBM. a) Top hits from primary screen, showing gene-level p-value in BT 145 (bar graph), with proportion of shRNAs underrepresented in BT 145 and BT 159 (pie charts), and nuclear/cytoplasmic expression of protein; the dotted orange and solid black lines divide targets with BT 145 p-values <0.001 from 0.001–0.01; b) Secondary screen results showing mean underrepresentation of target shRNAs in output compared to input samples in BT 145 tumors compared to BT 145 cell culture (left) and BT 159 cell culture (right), with BPTF indicated by red arrows; c) Volcano plot showing overall fold change (x-axis) and gene-level p-value (y-axis) for a separate epigenomic shRNA screen in DIPG 4, with BPTF highlighted; d) Expression of BPTF in publicly available tumor/normal brain datasets from the R2 platform; e) Western blot of BPTF and MYC expression in normal human astrocytes (NHA), adult HGG cell lines (BT 145, T387, T3691) and pediatric HGG cell lines (DIPG 4, SF7761, GBM1, DIPG 7, DIPG 33 and DIPG 6). Error bars indicate SEM.

