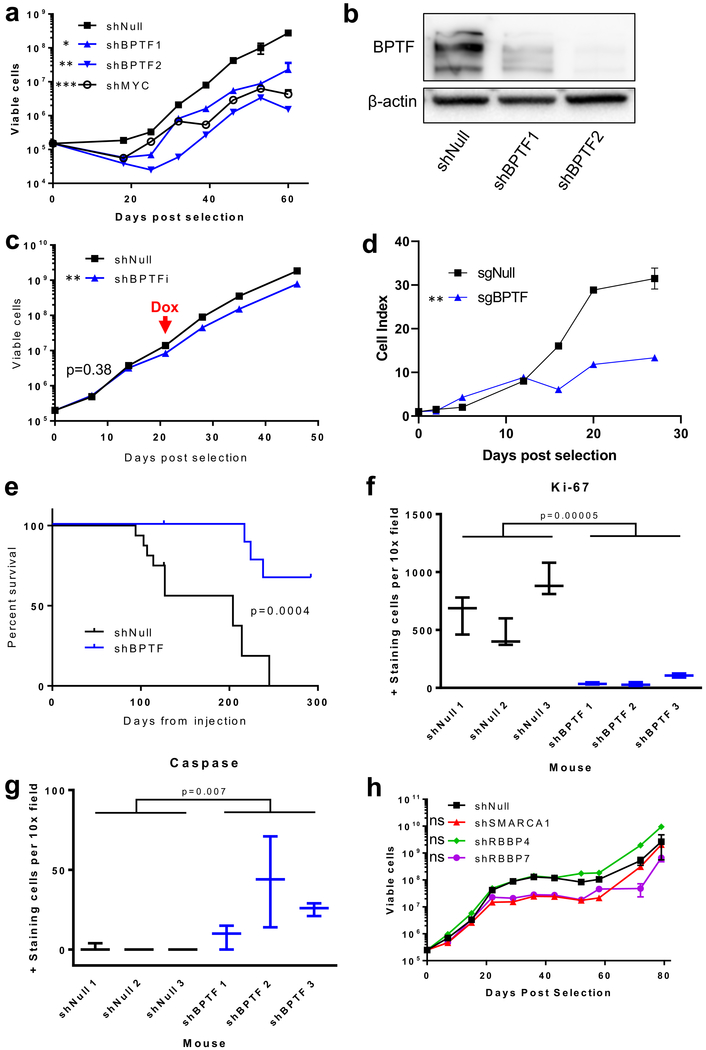
Figure 2:
Validation of independent BPTF growth effect in BT 145. a) Growth curve showing effect of BPTF and MYC knockdown; b) Western blot showing BPTF knockdown via shRNA at the protein level; c) Growth curve showing the effect of doxycycline-inducible BPTF knockdown starting at the red arrow; d) Growth curve showing effect of BPTF knockout by CRISPR-Cas9; e) Kaplan-Meier curve showing the effect of BPTF knockdown on survival in a murine orthotopic BT 145 PDX model; f) Comparison of Ki-67 positive-staining cells by IHC for shNull compared to shBPTF PDX sections; g) Comparison of caspase positive-staining cells by IHC for shNull compared to shBPTF PDX sections; h) Growth curve showing the effect of knockdown of other NURF complex members. Error bars indicate SEM. * p<0.05; ** p<0.01; *** p<0.001; ns p>0.05

