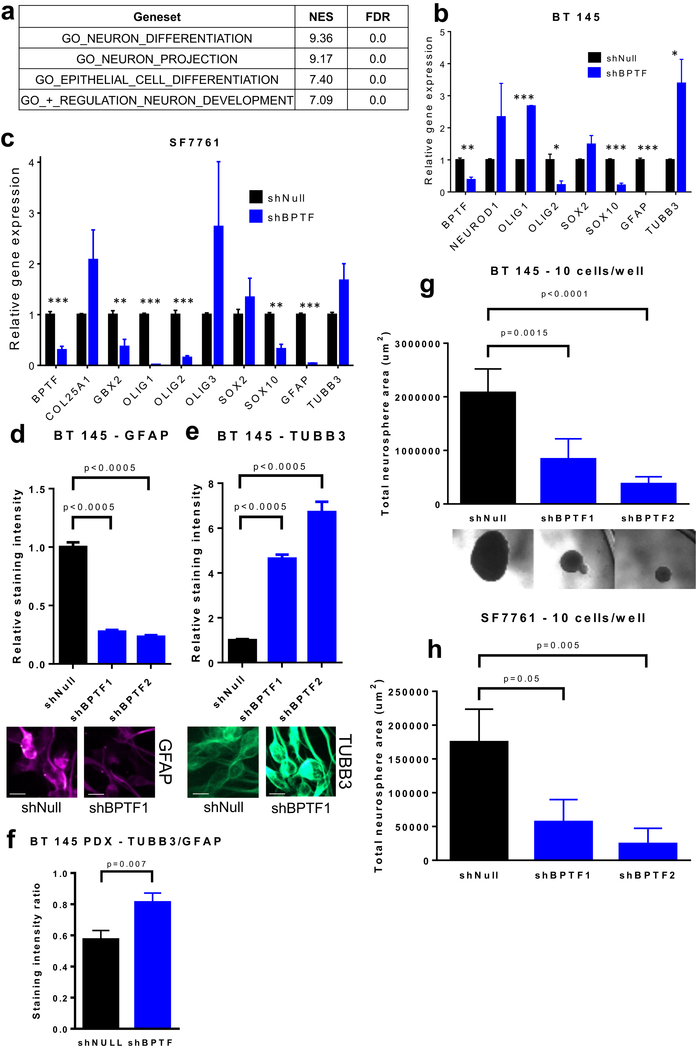
Figure 4:
Effect of BPTF knockdown on differentiation and cell self-renewal. a) GSEA statistics for gene sets related to neuronal characteristics in BT 145 cells with BPTF knockdown; b-c) Gene expression analysis via qPCR for neuronal differentiation targets in BT 145 and SF7761; d-e) Comparison of staining intensity for GFAP and TUBB3 by immunofluorescence for BPTF knockdown BT 145 cells, with representative images underneath (scale bars represent 10 μm); f) Comparison of TUBB3/GFAP staining intensity ratio for BT 145 PDX sections; g-h) Results of neurosphere dilution assays showing effect of BPTF knockdown on total neurosphere area in BT 145, with representative images overhead, and SF7761. Error bars indicate SEM. * p<0.05; ** p<0.01; *** p<0.001

