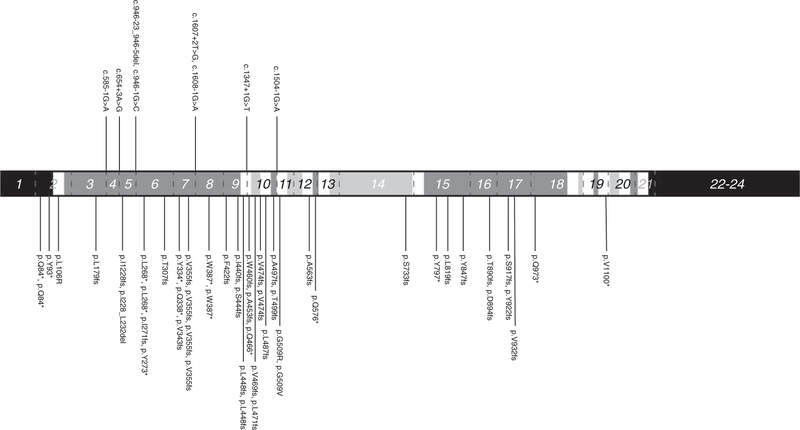
FIGURE 4.
Distribution of non-synonymous PTCH1 mutations by protein domain in sporadic KCOT. cDNA position based on transcript NM_000264. Dotted lines indicate exon boundaries. Black, white, light gray, and dark gray shades represent C/N terminals, transmembrane domains, intracellular domains, and extracellular domains, respectively. Exons are numbered and exons 1, 22, 23, and 24 are displayed in abbreviated lengths.

