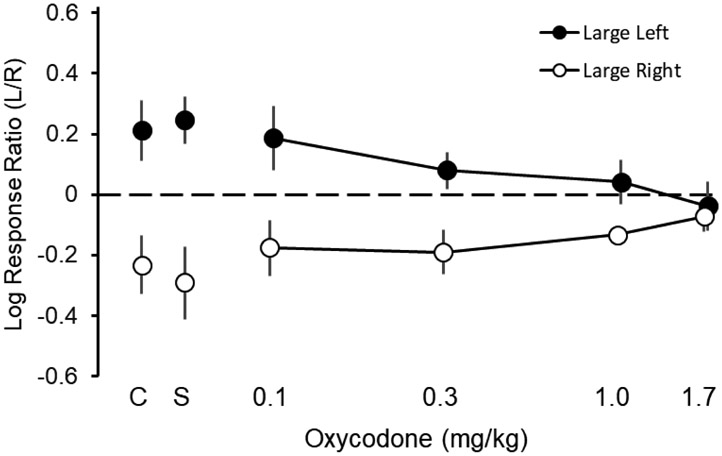
Fig. 3.
Oxycodone dose-effect functions on choice. Log response ratios (L/R) during the initial links for large-left sessions (filled circles) and for large-right sessions (unfilled circles) are plotted as a function of oxycodone dose. Points above C are data from no-injection control sessions, and points above S are data from sessions preceded by saline injections. Data points are means and error bars show 95% CIs; the absence of an error bar indicates that the 95% CI falls within the size of the data point. The dashed line at zero indicates the point at which the number of responses on the left and right lever during the initial links are equal (i.e., indifference).

