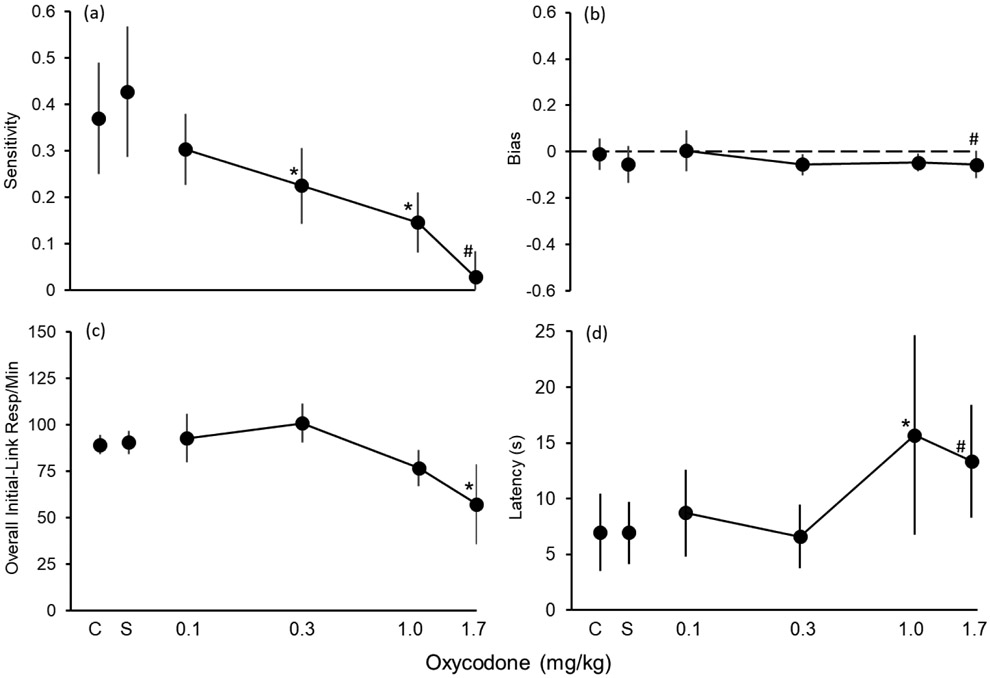
Fig. 4.
Oxycodone dose-effect functions for sensitivity to reinforcement magnitude (a), bias (b), overall initial-link response rates (c), and rear-lever press latency (d). Data points are means, and error bars are 95% CIs. Asterisks (*) indicate data at that dose were significantly different than the data at saline (p < 0.05). Pound signs (#) indicate that those data from 1.7 mg/kg were not included in the statistical analysis. See text for an description of the methods used to derive sensitivity and bias and the characteristics of the statistical analyses.

