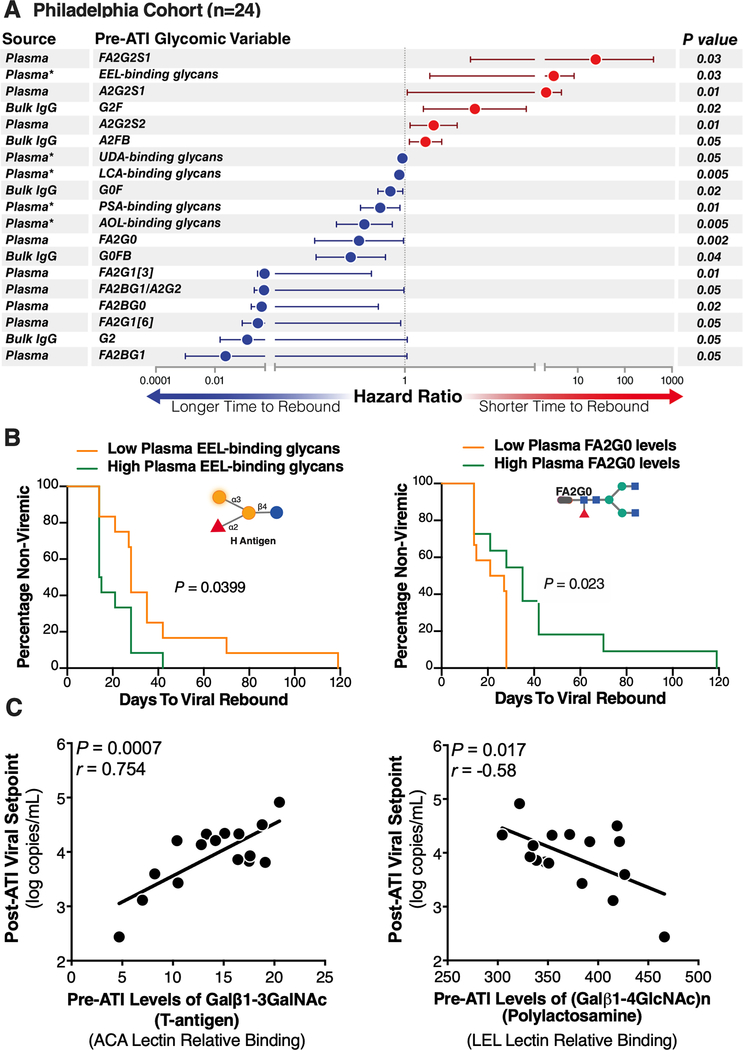
Figure 1. Plasma and IgG glycomic biomarkers of time-to-viral-rebound and viral setpoint in the Philadelphia Cohort.
(A) Cox proportional-hazards model of glycomic biomarkers identified using samples from the Philadelphia Cohort. F=Fucose, G=Galactose, S=Sialic acid, B=Bisected GlcNac. Plasma* = data generated using lectin microarray; remaining data generated using capillary electrophoresis. (B) Mantel-Cox model illustrating two glycan structures from A. (C) Pre-ATI plasma glycomic signatures associated with a higher or a lower viral setpoints post-ATI in the Philadelphia Cohort. Pearson correlation coefficient.

