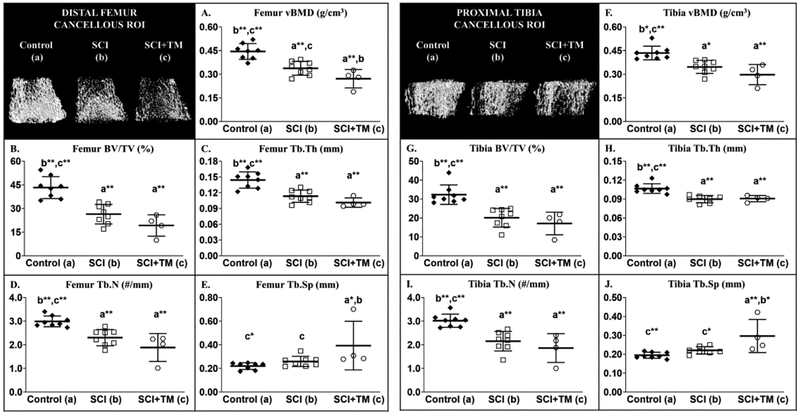
Figure 2 A–J.
Microcomputed tomography (μCT)-derived cancellous bone outcomes from our preliminary bone study that involved non-surgical Control animals or those that received spinal cord injury (SCI) alone or in combination with bodyweight-supported treadmill training (SCI+TM). Images represent cancellous bone within each region of interest (ROI). Values are means ± SD, n=4–8/group, as described in methods. Symbols represent individual animal data points. Letters indicate differences vs respectively labeled groups at p<0.05, *<0.01, or **<0.001 (a = vs Control, b = vs SCI, c = vs SCI+TM). vBMD, volumetric bone mineral density; BV/TV, cancellous bone volume; Tb.N, trabecular number; Tb.Th, trabecular thickness; Tb.Sp, trabecular separation.

