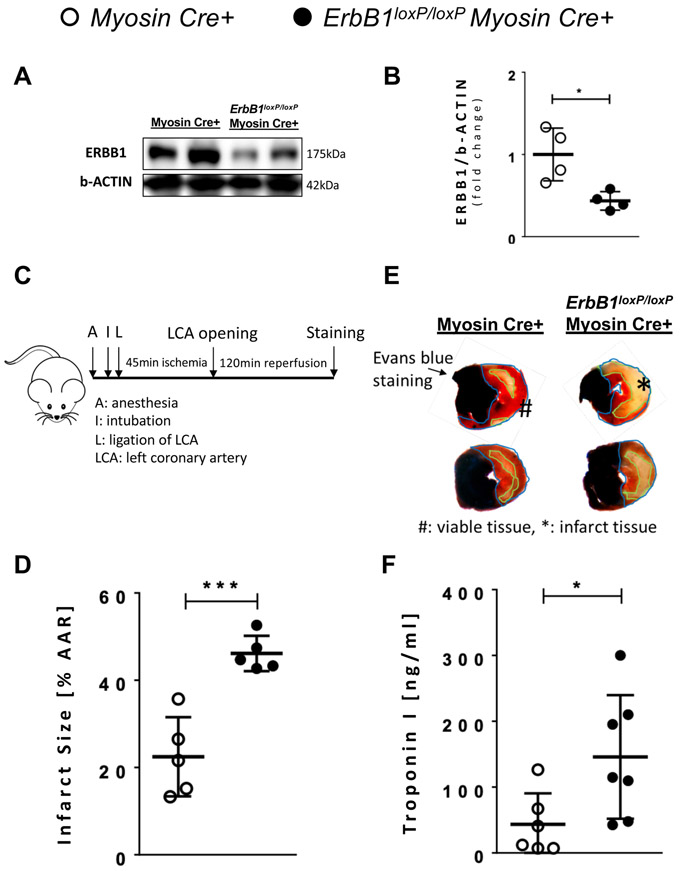
Figure 5. Tamoxifen induced knockout of ERBB1 in cardiac myocyte results in larger infarct size.
Myosin Cre+ and ErbB1loxP/loxP Myosin Cre+ mice were given tamoxifen daily at a dose of 1 mg via intraperitoneal injection for 5 consecutive days. Animals were then given a recovery period of 7 days. A ERBB1 protein levels after tamoxifen-induced in vivo knockout of ErbB1 in cardiac myocyte; β-ACTIN was used as a loading control. Myosin Cre+ and ErbB1loxP/loxP Myosin Cre+ mice underwent 45 minutes of ischemia by total occlusion of LCA. One representative blot from three independent experiments is shown. B Densitometry of ERBB1 western blots (n=4 per group). C Schematic of how surgery was performed. Infarct size was measured after double staining with 1% Evan’s blue and 1% triphenyltetrazolium chloride (TTC). Infarct sizes were normalized by percentage of infarct size to the AAR. D Infarct size after 45 minutes of ischemia and 2 hours of reperfusion in Myosin Cre+ and ErbB1loxP/loxP Myosin Cre+ mice (n=5 per group). E Representative infarct staining results from Myosin Cre+ and ErbB1loxP/loxP Myosin Cre+ mice. F Cardiac troponin I (TnI) levels determined by ELISA. Blood was collected from the portal vein after 45 minutes of ischemia and 2 hours of reperfusion in Myosin Cre+ (n=6) and ErbB1loxP/loxP Myosin Cre+ mice (n=7). The difference between infarct size measurement and cardiac TnI sample number are addressed in the methods section. *p<0.05, ***p<0.001, n.s., nonsignificant. Data are presented as the mean ± SD. (B, D, and F) unpaired, two-tailed t-test. A total of 10 mice were used in the studies for Figure 5, and none of the results were excluded from the analysis. B t=3.32, df=6 D t=−5.33, df=8 F t=−2.67, df=12

