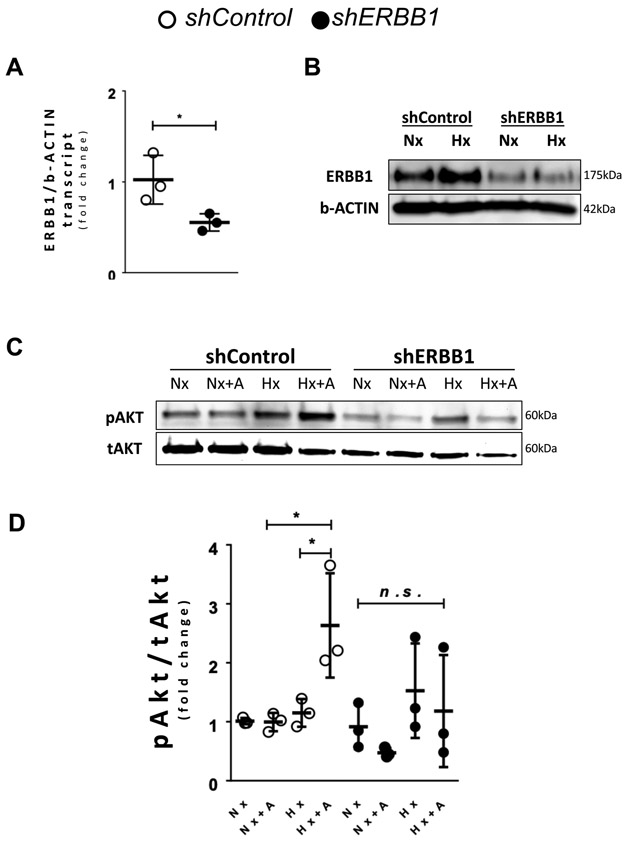
Figure 6. Upregulation of phosphorylated Akt levels occur after hypoxia and concomitant AREG treatment.
(A-D) ERBB1 was knocked down using shRNA in HCM via lentiviral transfection. The shControl was transfected with lentivirus containing an empty vector. A ERBB1 transcript levels after knockdown of ERBB1 (n=3 per group). B ERBB1 protein levels in normoxia (Nx) and hypoxia (Hx); β-ACTIN was used as a loading control. HCM cells were exposed to normoxia (Nx) or hypoxia (1% oxygen) for 16 hours. One representative blot from two independent experiments is shown. C pAkt (Ser473) levels were assessed in shControl and shERBB1 HCM after 16 hours of normoxia (Nx) or hypoxia (Hx), followed with or without subsequent 20 nM amphiregulin (AREG) treatment for 10 minutes (+A). One representative blot from three independent experiments is shown. D Densitometry of phosphorylated Akt western blots, which is expressed as a ratio of phosphorylated Akt to total Akt (pAkt/tAkt) (n=3 per group). *p<0.05, n.s., nonsignificant. Data are presented as the mean ± SD. A unpaired, two-tailed t-test. D Three-way ANOVA and Bonferroni adjustment for comparisons between Nx and Hx, as well as between with and without +A. A t=2.87, df=4 D F7,16=3.8, p=0.013

