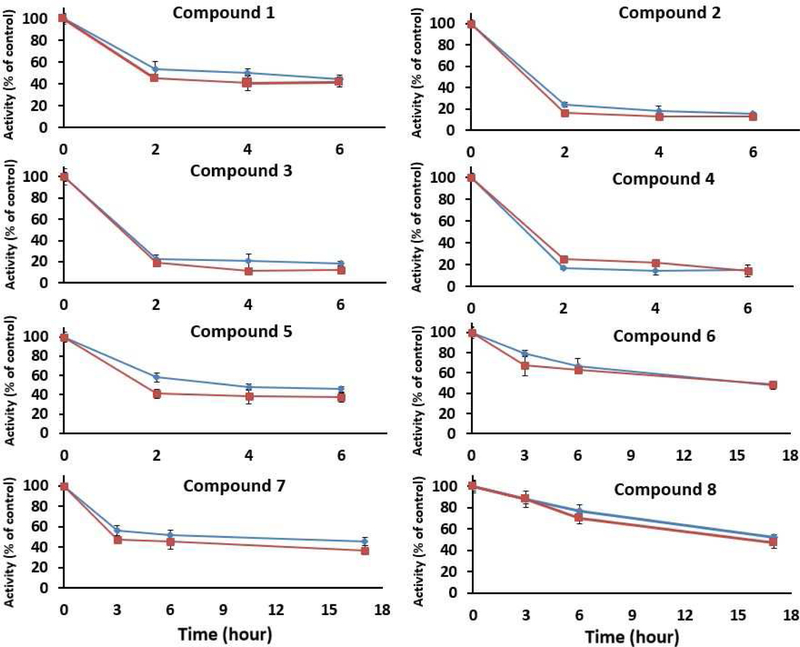
Figure 4. TGR activity in treated worms.
Worms were treated with compounds (50 μM) and collected at indicated times, homogenized, and homogenates were analyzed for TrxR activity (DTNB reduction,  ) and GR activity (GSSG reduction,
  ). Assays were done in triplicate and compared to activities in untreated worms collected at the same times.

