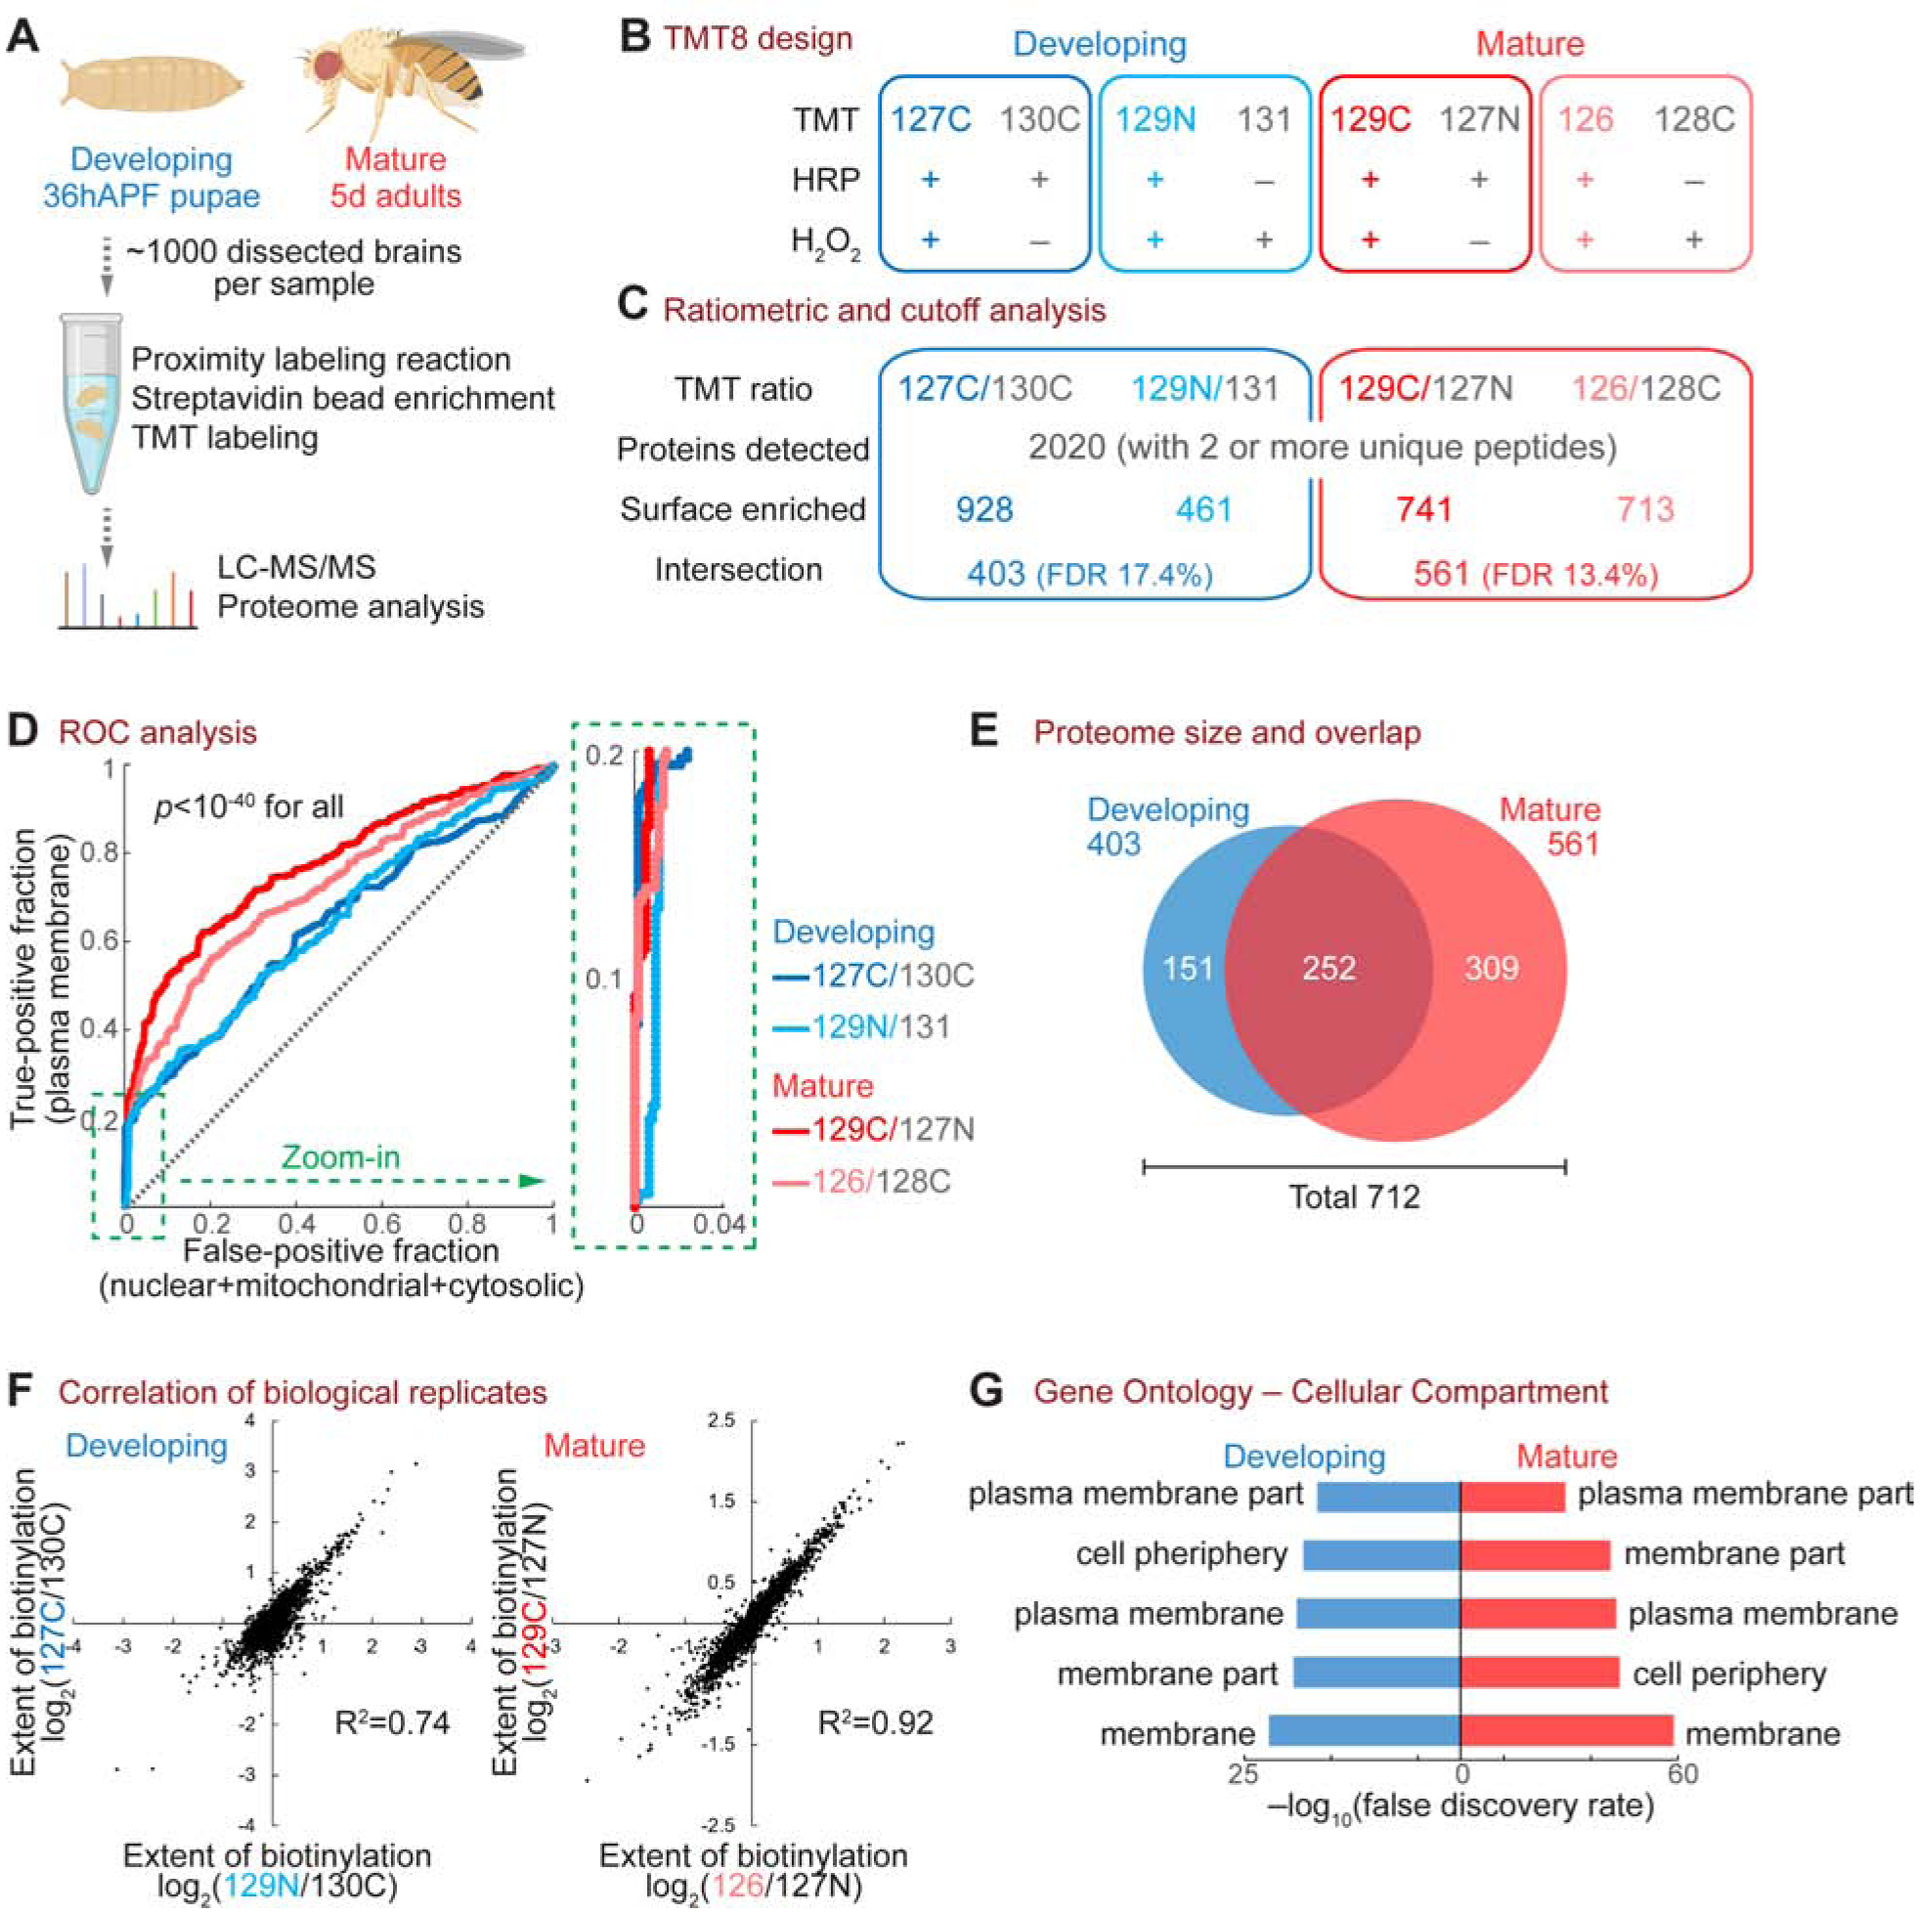
Figure 2. Cell-Surface Proteomic Profiling of Developing and Mature PNs.

(A) Workflow of the PN surface proteomic profiling.
(B) Design of the 8-plex tandem mass tag (TMT8)-based quantitative proteomic experiment. Each time point comprised two biological replicates (blue or red) and two negative controls (grey). Labels in the “TMT” row (e.g., 127C) depict the TMT tag used for each condition.
(C) Numbers of proteins after each step of the ratiometric and cutoff analyses.
(D) Receiver operating characteristic (ROC) curve of each biological replicate. Proteins were ranked in a descending order based on the TMT ratio. True-positive denotes plasma membrane proteins curated by the UniProt database. False-positive includes nuclear, mitochondrial, and cytosolic proteins without membrane annotation by UniProt. The top 20% region (dotted green box) is enlarged on the right. A two-sample Wilcoxon rank-sum test was used to determine the statistical significance.
(E) Venn diagram of developing and mature PN surface proteomes, after ratiometric and cutoff analyses. These two proteomes contain 712 proteins in total, with 252 proteins shared by both stages.
(F) Correlation of biological replicates.
(G) Top 5 Cellular Compartment terms of the developing and mature PN surface proteomes in gene ontology analysis.
