
Figure 3. Temporal Evolution of the Cell-Surface Proteome in Accord with PN Development and Function.
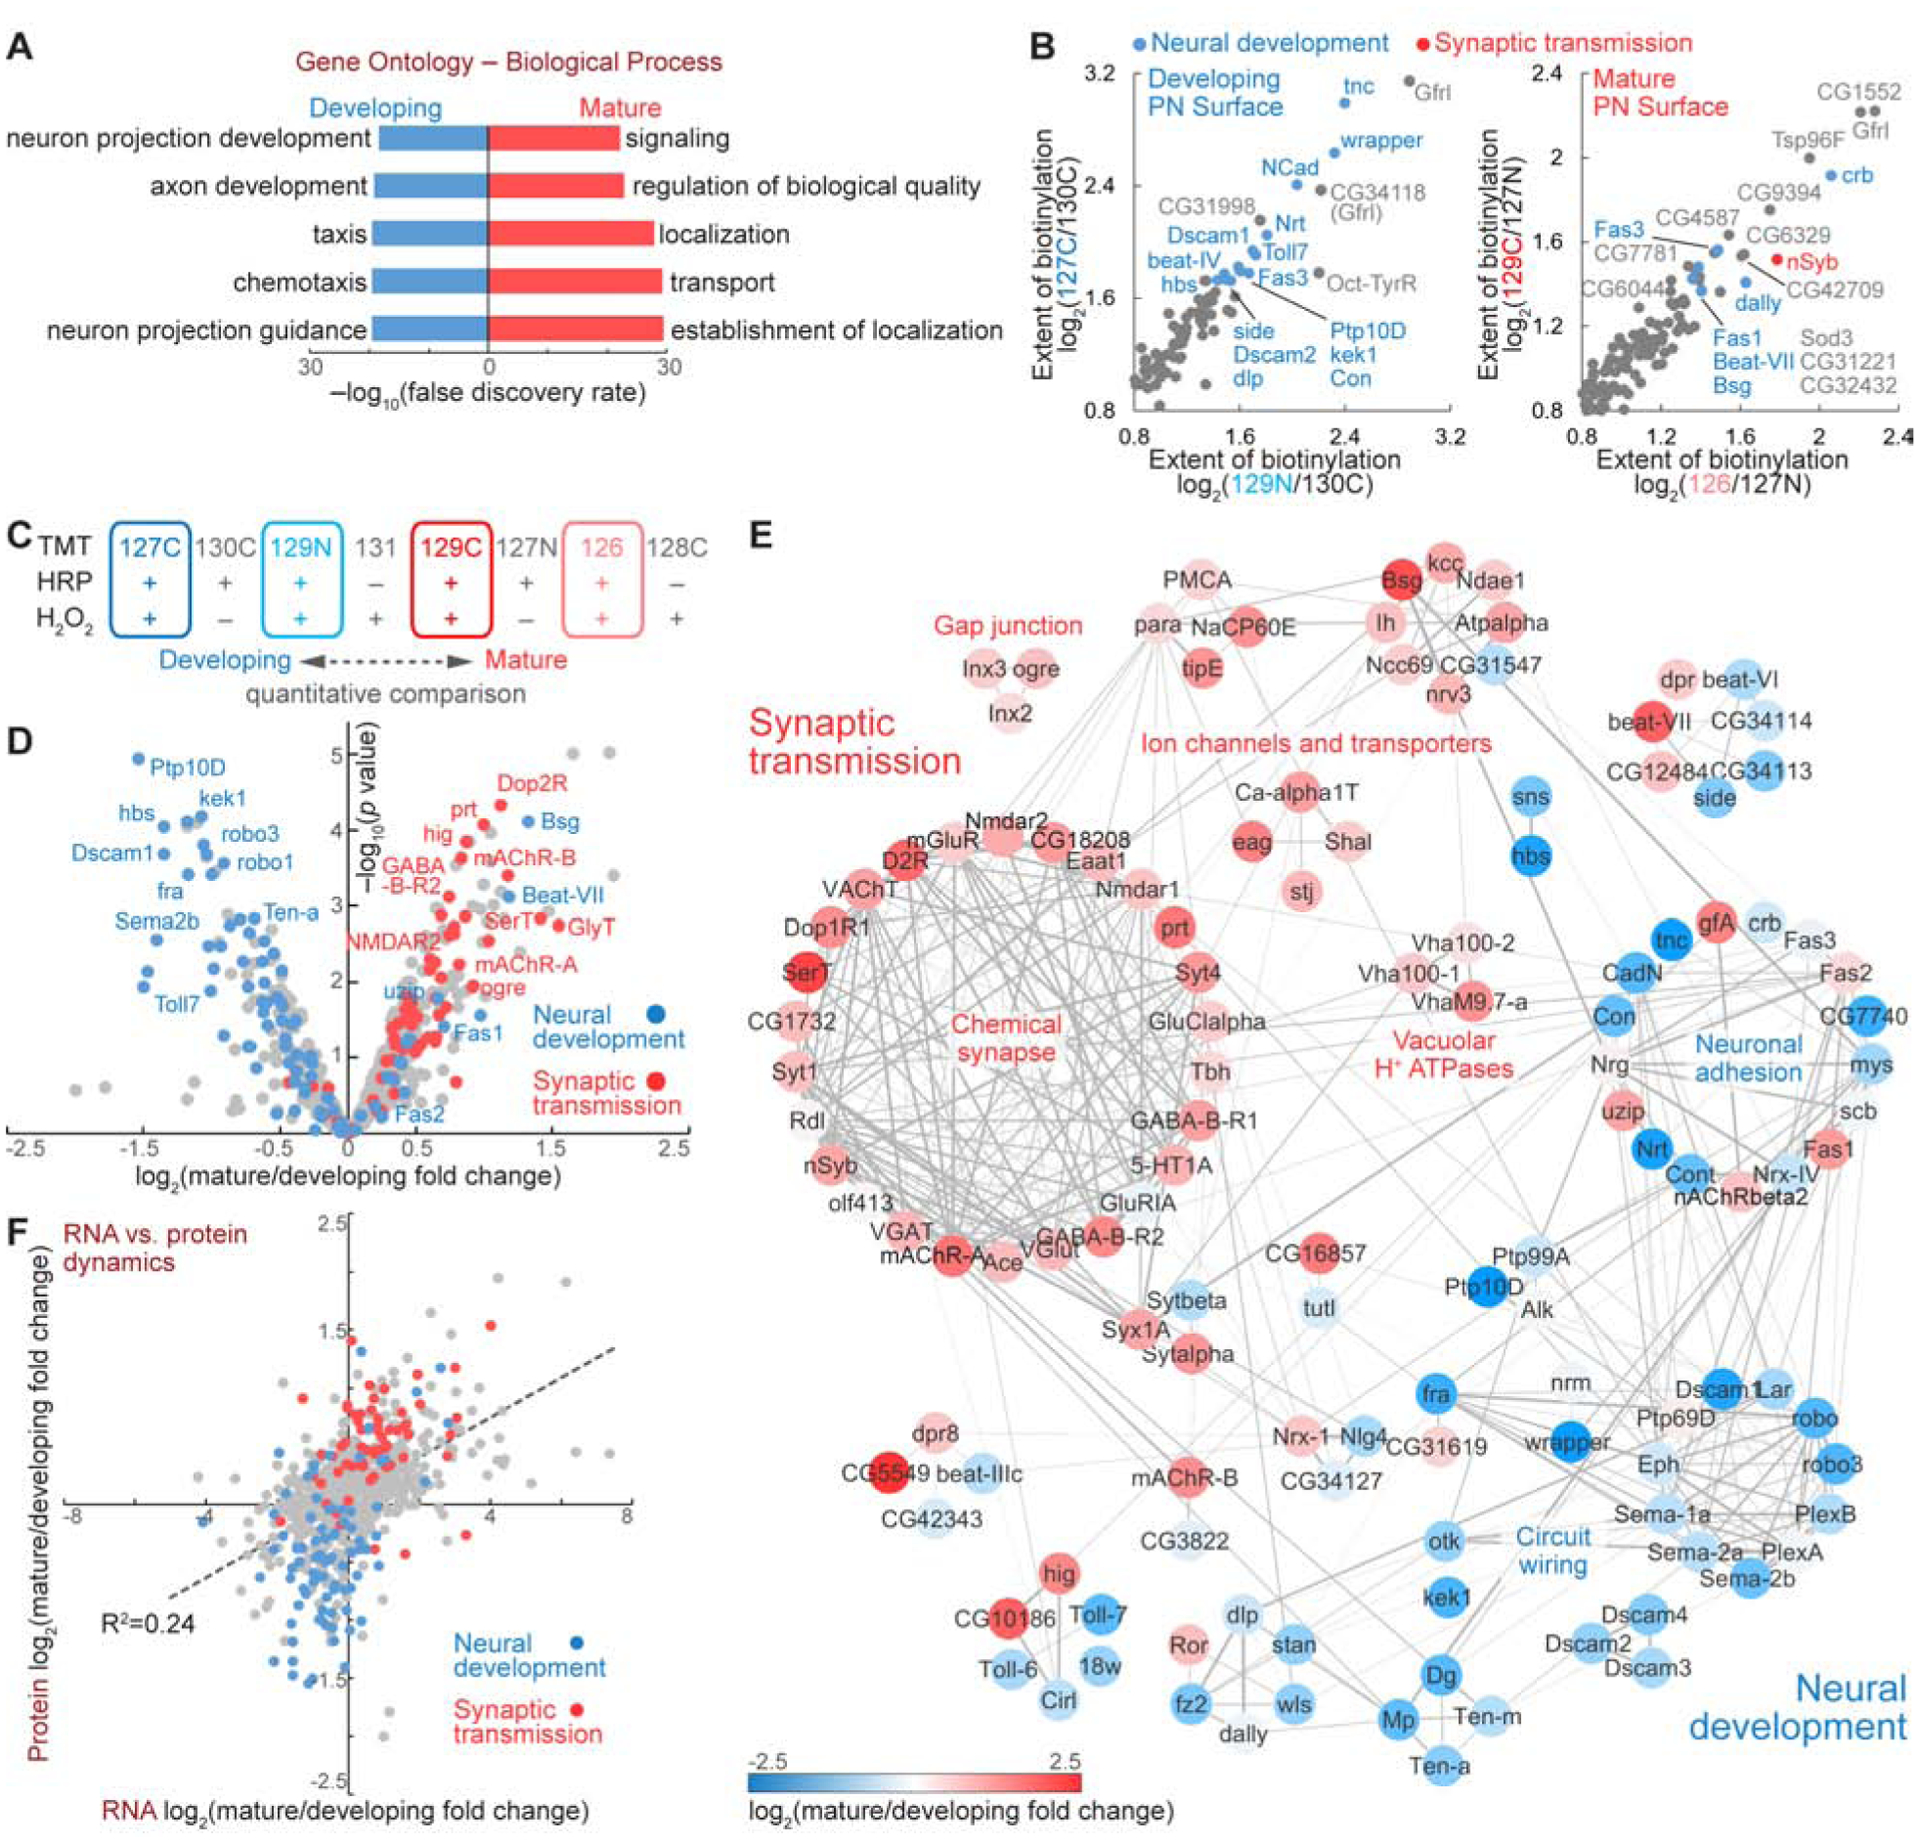
(A) Top 5 Biological Process terms of the developing and mature PN surface proteomes in gene ontology analysis.
(B) Most enriched proteins on the developing and mature PN surface, respectively. Blue, known neural development molecules; red, known synaptic transmission molecules.
(C and D) TMT-based quantification revealed the expression change of cell-surface proteins in PN development and maturation.
(E) Coordinated expression change of functionally associated molecular complexes in developing and mature PNs. Markov clustering was performed with protein-protein interaction scores from the STRING database. Grey lines denote protein-protein interactions. Nodes are color-coded based on the expression change (color scale at the bottom).
(F) RNA vs. protein changes of PN surface molecules. Dashed line depicts the linear regression.